News
Altcoin News
Altcoin News
Browse all Altcoin related articles and news. The latest news, analysis, and insights on Altcoin.
OP Comment and Price Analysis 1 May 2025
OPOptimism (OP) broke the falling channel structure in which it was trapped for a long time upwards and made a retest after this breakage. Currently, the price is trading at the level of $ 0.741, and the process until it reached this level presented a rather instructive structure from the point of view of technical analysis.OP, which is outside the channel, first experienced a withdrawal after this fracture, then re-tested this region and confirmed it as support. So, in retrospect, the downward trend seems to be over. Now it is time for the price to break the resistance in front of it and enter a stronger upward process. OP Channel Fracture Support Zones: $0.700 – $0.680: Short-term support area $0.640 – $0.575: Main support $0,500 and below: Major supportResistance Zones: $0.801: Deceleration resistance $0.949 – $1.016: Medium-term resistance band $1,230: The critical level for a broad-based trend reversal $ 1,491 – $1,596: The major resistance area that can be targeted during the continuation of the trend $1,971: Long-term target regionThe rise that started from the bottom of the OP at the end of March seems to have entered a limited correction process as of now. The fact that the price tested the $ 0.801 level again and broke it this time may confirm the reversal of the trend by disrupting the channel structure.if daily closures come above $0.801, the OP Coin will have exited the falling channel and the initial target may be the $0.95 – $1.01 band. In case of possible withdrawals, the December of $ 0.70 – 0.68 should be followed as a strong support. He is cautious in case he re-enters the channel, but if a fracture occurs, a more aggressive position can be taken.As a result, the OP now seems ready for the upward process, along with the breakdown and retest of the falling channel in the big picture. Although there is a short-term correction process, a break of $0.801 in the coming days may be a harbinger of a new upward trend. For investors, this is a period that needs to be patient and careful right now.These analyses, which do not offer investment advice, focus on support and resistance levels that are thought to create trading opportunities in the short and medium term according to market conditions. However, the responsibility for making transactions and risk management belongs entirely to the user. In addition, it is strongly recommended to use stop loss in relation to shared transactions.

ZRO Comments and Price Analysis 1 May 2025
ZROZRO has started to give strong signals in technical terms after a long period of decline. The price broke the red trend line on the chart to the upside and started to test important resistances after this break. Currently priced at $2,744, the ZRO is consolidating just above the region where selling pressure has been concentrated in the past. ZRO Trend Breakage Support Zones:$2,764 – $2,582: Current horizontal support - the price is trying to hold on here$2,179: Medium-term main support zone$1,770 – $1,550: Major supportResistance Zones:$ 3,350: The peak of the last rise – the first target$4,060 – $4,347: Large-time major resistance area$5,372: Long-term target in the continuation of the riseThe falling trend line shown in red on the chart has now been left behind. The price not only broke this line upwards, but also created a strong support ground in the December of $ 2.58 – $ 2.76. The support-resistance transformation (SR Flip) seems to be completed in this region now.If the price continues to stay above this zone, it can be expected that the rise will regain momentum and the $ 3.35 level will be tested in the first place. If this level is broken, the first target will be $ 3.35, followed by the $ 4.06 – $ 4.34 band. In case of a downward break, the $ 2.58 region should be carefully monitored. If this region is lost, short-term weakening may be observed.In summary, with the breaking of the falling trend for ZRO, a period may have closed in a technical sense. A new bullish wave can be triggered if the jamming area that is currently forming breaks to the upside. However, for this scenario to strengthen, it is necessary that the price remains above $ 2.76. The technical structure is strong, but it would be the healthiest strategy to stay on track instead of opening a transaction without confirmation.These analyses, which do not offer investment advice, focus on support and resistance levels that are thought to create trading opportunities in the short and medium term according to market conditions. However, the responsibility for making transactions and risk management belongs entirely to the user. In addition, it is strongly recommended to use stop loss in relation to shared transactions.

EDU Comments and Price Analysis 1 May 2025
EDUEDU has been moving in a hard downtrend for a long time and has gone through a period that has forced its investors. However, there has been a very positive development on the charts in recent days: the price has come out of the long-standing falling channel with a strong break. This technical break gives an important hint that the price may start rising again.EDU is currently trading around $0.1440. The rise that took place recently managed to move the price up to the level of $ 0.1544 in a short time. This rise can be interpreted as the beginning of a new upward momentum for EDU. Trend Breaking at EDU Technical Levels: Supports and Resistances that Need to be ConsideredSupport Levels:0.1440 - 0.1400 $: Current and Dec support level, the price is trying to hold on here.0.1250 – 0.1160 $: Important support area for confirmation of channel breakage.$ 0.1000: Psychological support as one of the bottom levels.Resistance Levels:$0.1544: The first tested resistance point after the break.0.1927 – 0.2108 $: The most critical resistance zone to target in the medium term.$0.2710: Another resistance that can be tested if the uptrend strengthens.$0.3484 - $0.3810: The critical return zone in the long term.EDU may have started a new upward trend with the breaking of the falling channel structure. Nevertheless, the critical point for investors right now will be to ensure permanence above the $0.1440 level. If the price manages to hold on here and starts rising again, the December of $ 0.1927 – 0.2108 will be targeted in the first place. Daily closures above this region, on the other hand, may make the rise even stronger and bring the $ 0.2710 levels to the agenda. In case of possible pullbacks, maintaining the $0.1250 – $ 0.1160 support zone will be critical for the continuation of the bullish scenario.As a result, this technical breakage in the EDU chart indicates that the negative weather that has been going on for a long time may be changing now. It is now the time for investors to be patient and careful. Even if there are short-term retreats, we are technically facing a more positive and promising outlook. EDU may have re-entered the radar of investors.These analyses, which do not offer investment advice, focus on support and resistance levels that are thought to create trading opportunities in the short and medium term according to market conditions. However, the responsibility for making transactions and risk management belongs entirely to the user. In addition, it is strongly recommended to use stop loss in relation to shared transactions.

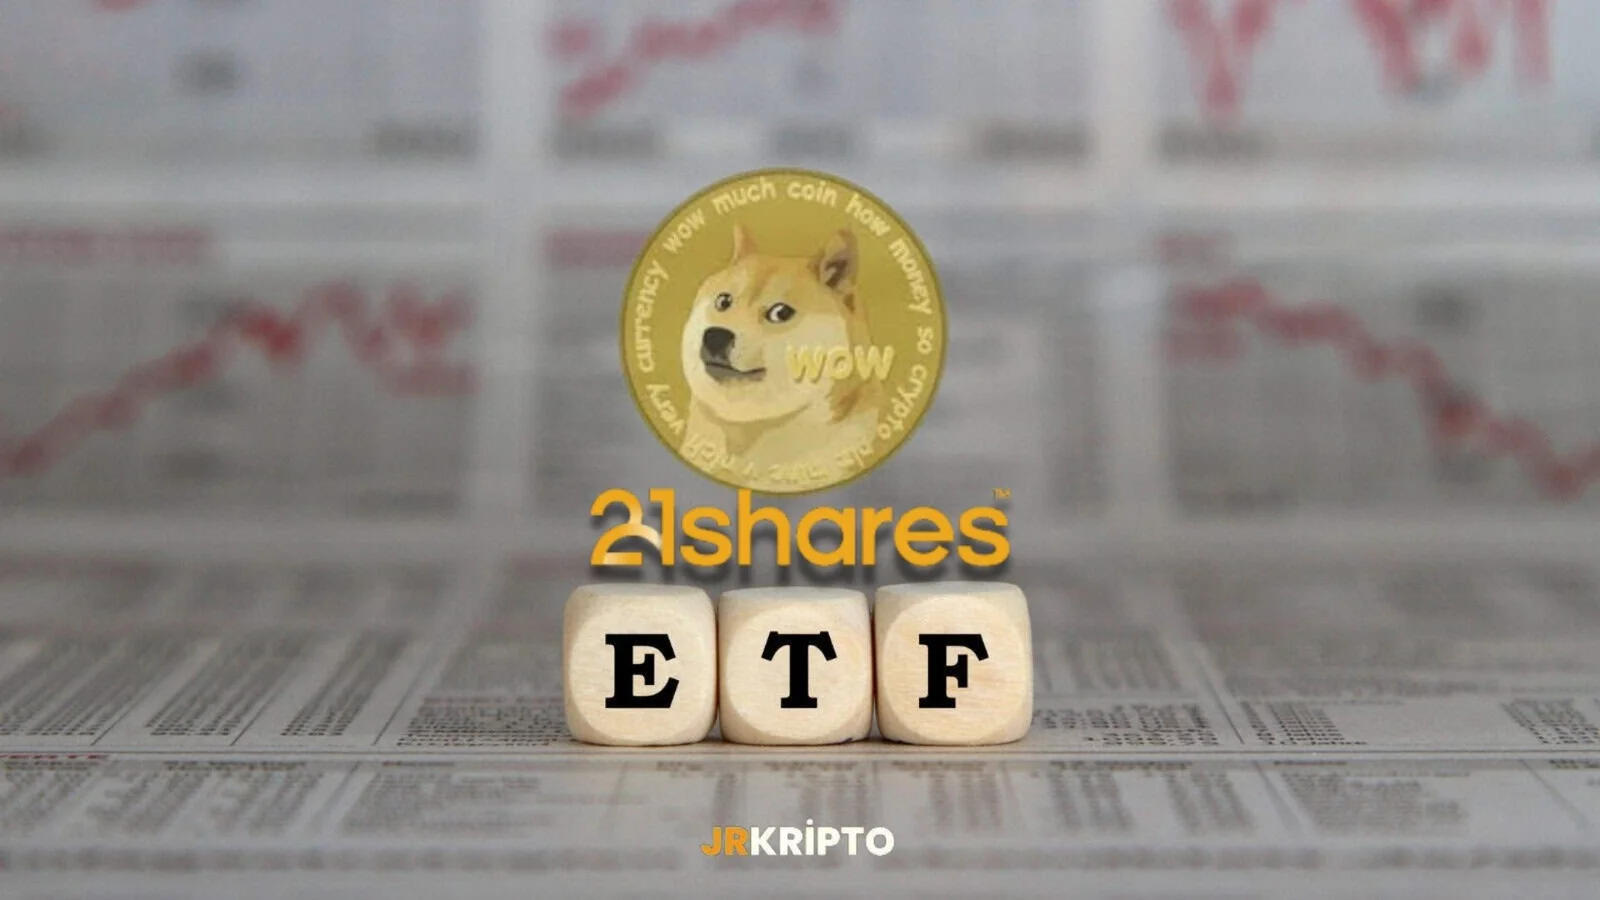
Dogecoin ETF Move from 21Shares: Meme Coins Make Their Debut on the Stock Exchange
A notable development has occurred in the crypto finance world. Switzerland-based investment firm 21Shares has filed for a spot ETF for Dogecoin (DOGE) in the United States.This marks the first-ever ETF application offering institutional access to a "meme coin" like DOGE through a stock exchange-traded fund.Spot DOGE ETF: What Does It Mean?21Shares has submitted its application to the SEC for the ETF to be listed on Nasdaq.The ETF will directly track the price of Dogecoin, meaning investors will be able to invest in DOGE’s price movementwithout actually purchasing the token.If approved:Institutional investors will gain direct exposure to DOGE.Dogecoin will attain the status of a regulated investment product.The market perception of meme coins could shift significantly.After Bitcoin and Ethereum, Is It Dogecoin’s Turn?The approval of spot Bitcoin and Ethereum ETFs marked the beginning of a new era in the crypto market.Dogecoin now stands out as the first meme coin to take this step.If the DOGE ETF is approved:Institutional demand could rise.It may pave the way for new ETF applications for other altcoins.However, the process is still at the approval stage.The SEC’s stance on volatile assets will be key in shaping the decision.Who Is 21Shares?21Shares is a company known for launching multiple ETFs and ETPs based on Bitcoin, Ethereum, and crypto index baskets.Its goal is to bridge the gap between traditional capital markets and digital assets.The DOGE ETF Could Mark the Start of a New EraThe application by 21Shares is not just a new product—it could represent a significant milestone in the institutionalization of Dogecoin and similar assets.If approved, DOGE would become the first meme coin to trade on traditional markets.All eyes are now on the SEC.This decision could impact not only Dogecoin but the entire crypto ETF landscape.
CETUS Comments and Price Analysis 30 February 2025
CetusCETUS has attracted attention in recent weeks with its impressive price action.The upward wave that started from $0.0780 almost tripled the price in a short time, reaching as high as $0.2617.With this rally, a significant transformation occurred both in technical indicators and investor sentiment.Currently, the price is trading around $0.2044, which represents an attempt to recover after a rejection from an important psychological and technical resistance zone.In other words, we are at a decision point. CETUS Current Support and Resistance Zones Support Zones:$0.1941: Current support – price is trying to hold here after rejecting from resistance$0.1557 – $0.1440: Strong short-term support – if retested, buyers may step in$0.1186 – $0.1080: The bottom area where the last upward move startedResistance Zones:$0.2419 – $0.2617: Critical resistance band that needs to be broken$0.3335: Broader time-frame targetCETUS has not only moved up rapidly but has also built a healthy upward structure.During the rally that started from the bottom levels, volume also increased notably — suggesting that the rise could be a structural transformation rather than just a short-term speculation.The price structure is now creating higher lows and higher highs, indicating a classic bullish trend formation.However, the $0.2617 resistance is a key level where heavy selling occurred in the past, and it should be monitored carefully.Until this zone is broken, it would not be surprising to see the uptrend slow down or the price move sideways for a while.Holding above $0.1941 is important for the continuation of the positive scenario.If the price rises again towards the $0.2419–$0.2617 band, how the price behaves in this region will determine the future of the trend.In the event of a breakout above the resistance, the next target to watch would be $0.3335.In case of a pullback, closing below $0.1557 could signal a deeper correction.Summary:CETUS may have initiated a new trend with the strong price action it demonstrated over the past weeks.The bullish structure is technically supported, volume is positive, and a critical resistance is being tested.If a breakout occurs, much higher levels could come into focus for CETUS.However, it is crucial for investors to act strategically and plan according to key levels.These analyses do not constitute investment advice.They focus on support and resistance levels that are believed to offer short- and medium-term trading opportunitiesdepending on market conditions.All trading and risk management responsibilities lie solely with the user.Additionally, using stop-loss orders is strongly recommended for any trades mentioned.

WLD Comments and Price Analysis 29 February 2025
WLDWorldcoin has recently gone through a recovery process that has drawn attention in the crypto markets. The price, which had long been under pressure, has not only broken its short-term descending trend, but also made a strong bounce from the lower band of its long-term channel structure. These two technical developments suggest that a brand-new chapter may have opened for WLD.The current price is at $1.097, and the charts indicate that important resistances are being tested in the short term, while in the long term, we are facing signals of a structural transformation.Short-Term Outlook: Downtrend BrokenWith the uptrend that began from the $0.60 level, WLD has clearly broken the descending trendline, which previously acted as a strong resistance multiple times. After this breakout, the price quickly tested the $1.22 level, where a short-term pause occurred. However, if this zone is broken with strong volume, it would be a technical confirmation that the rally could deepen for WLD. Falling Trend Breakage Support Zones:$0.916: The level where the trend breakout occurred; currently acting as the main supportBelow $0.750: Liquidity supportResistance Zones:$1.127–$1.225: Current resistance, facing rejection here$1.550: Mid-term major resistance$1.960 – $2.130: Zone with broad-based selling pressure$2.759: Long-term target levelLong-Term Channel: Strong Reaction from the Lower BandIn the long-term view, as noted in our WLD analysis shared on April 11, we had indicated a potential bounce from the lower support of the fib channel shown on the chart. We are now witnessing a strong upward movement with momentum toward the middle of that channel.What’s more remarkable is that this breakout also occurred at the lower band of a long-term descending channel. With strong buying pressure from the bottom of this channel, WLD climbed toward the middle band and is now consolidating in this region. This is one of the clearest examples of a "healthy reversal structure" in technical analysis. General Channel View Long-Term Support Zones:$0.700 – $0.900: Lower band of the channel$0.560: Oversold zoneLong-Term Targets:$1.550: Middle band of the channel$2.400 – $2.700: Expansion targets toward the upper band$3.500 – $5.000: Major resistance zones that could be considered if investor sentiment shiftsIf WLD breaks through the resistance around $1.22, technical targets would be $1.55, followed by the $1.96 – $2.13range. Such a move would also indicate that the middle band of the long-term channel has been surpassed, which could lead to a faster acceleration of the uptrend.On the other hand, if the price decides to pause at these levels, a retest of the $0.91 – $1.09 band could create a healthy "new bottom" — showing that the positive structure remains intact.Summary:WLD has both broken its short-term downtrend, sparking a bullish move, and formed a significant reversal structurewith buying from the bottom of the long-term descending channel.If this move gains sustained strength, a new uptrend could replace the sharp declines seen in 2023 and 2024.These analyses do not constitute investment advice. They focus on support and resistance levels that are believed to present short- and medium-term trading opportunities depending on market conditions.All trading decisions and risk management are the sole responsibility of the user.Use of stop-loss orders is strongly recommended for any positions mentioned.

Digital Euro Move from ING Bank
One of Europe’s leading banks, ING, has taken a significant step as the European Union’s new crypto regulation MiCAcomes into force. The bank has formed a consortium with other financial institutions and crypto firms to develop a euro-backed stablecoin.MiCA Regulation and the Euro Stablecoin RaceMiCA aims to regulate the crypto asset market in Europe. It introduces strict rules, especially for stablecoin issuers, such as licensing requirements, holding reserves in European banks, and transparent reporting. In this new environment, stablecoins pegged 1:1 to the euro are expected to stand out.The stablecoin developed by ING will be fully compliant with these regulations. The goal is to create a digital asset that complies with European regulations and offers secure payment options in the market.ING’s Strategic MoveThis move shows that ING is not only keeping up with technology but also aims to become a strong player in the digital finance world. At a time when rival banks like Société Générale are also making similar moves, ING is acting swiftly to take its place in the digital euro race.Producing a regulation-compliant stablecoin could give ING a significant advantage in the development of Europe’s digital finance infrastructure.Europe Prepares for Digital AssetsFollowing MiCA, digital products in Europe will become more secure and transparent. A predictable digital payment ecosystem will emerge for investors and institutions. ING’s initiative may contribute to Europe gaining a strong position in the global digital finance race.ING Takes an Early LeadWith its MiCA-compliant euro-backed stablecoin project, ING is preparing early for the digital euro infrastructure. This initiative will not only move Europe’s digital payment systems toward a corporate and regulated structure, but also help the euro gain a stronger position in the digital asset market.

Big Move from 21Shares: ASUI Launch and ETF Application For Sui Blockchain
21Shares Launches Sui Staking ETP (ASUI) and Files for SUI-Based ETF in the U.S.As institutional interest in crypto markets continues to surge, 21Shares has made a bold move by unveiling its latest product: the 21Shares Sui Staking ETP (ASUI), built on the Sui blockchain. Simultaneously, the company has filed for a SUI-based ETF in the United States, aiming to open the door for greater institutional investment in the Sui ecosystem.What Is ASUI and What Does It Offer?The newly launched ASUI allows investors to directly benefit from the performance of the Sui blockchain while earning staking rewards. Designed as an attractive alternative for investors hesitant to dive directly into crypto, ASUI simplifies exposure to blockchain returns without the technical complexities.Key features of ASUI include:Physically-backed structure: ASUI is fully backed by actual SUI tokens.Institutional-grade security: Assets are securely custodied by Coinbase Custody.Seamless staking: Investors earn staking rewards without dealing with technical setups.Regulated and transparent: Traded on major exchanges, making it easily accessible.Filing for a SUI-Based ETF in the U.S.: A Major Institutional StepHot on the heels of the ASUI launch, 21Shares has officially filed for a SUI-based ETF in Delaware.ETFs offer investors the ability to gain exposure to crypto assets without directly purchasing or managing them, presenting several key advantages:Easy access: Tradeable through traditional brokerage accounts.Regulatory protection: Backed by better legal safeguards compared to direct crypto investments.High liquidity: Easy buy and sell options on public exchanges.No custody risks: Investors avoid managing private keys or wallet security.While the filing has been submitted in Delaware, the ETF must still receive approval from the SEC—a process that is often lengthy and complex, with no guaranteed outcome or timeline.Why the Sui Blockchain Is Gaining AttentionThe Sui blockchain has recently been making waves due to its high transaction speed, low latency, and excellent scalability.Developed by Mysten Labs, a team of former Meta engineers, Sui offers a robust infrastructure ideal for decentralized applications.Its flexibility enables use cases across a wide range of sectors, including gaming, NFT platforms, DeFi applications, and even social networks.SUI, the network’s native token, plays a vital role in staking, transaction fees, and governance activities within the ecosystem.The Importance of Institutional Investment for SuiThe introduction of ASUI and the filing for a SUI-based ETF could mark the beginning of a new era for the Sui blockchain.Opening secure and institutional-grade investment channels could significantly boost liquidity, price stability, and global recognition, while enhancing investor confidence.If the ETF gains regulatory approval, Sui could quickly rise as a key focus area within the financial markets, positioning itself at the forefront of blockchain innovation.

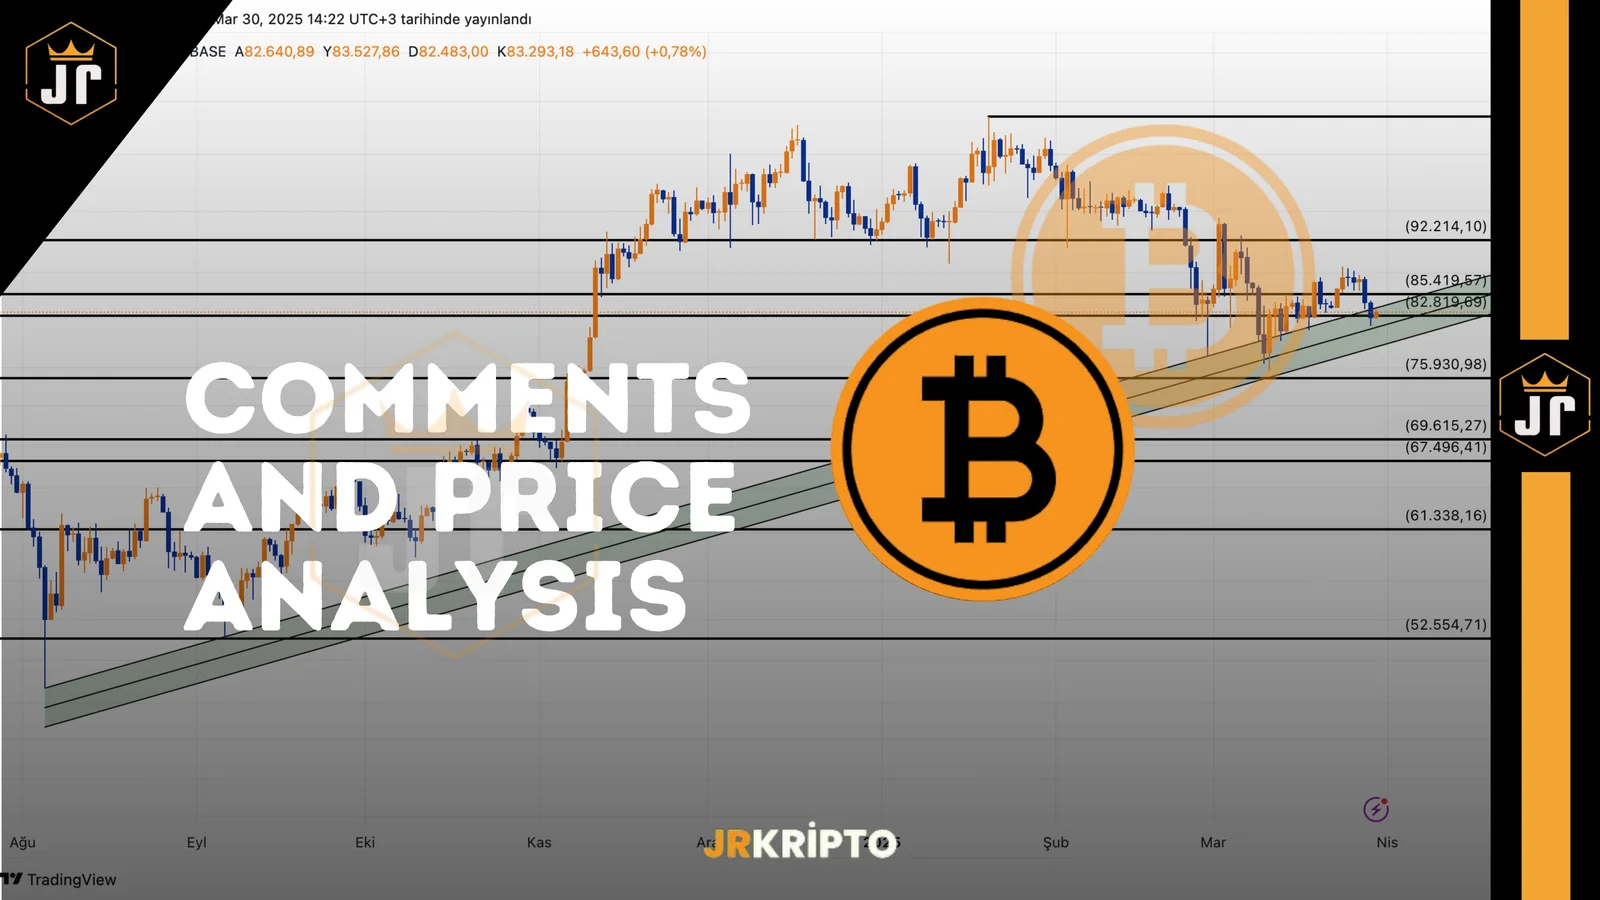
BTC, USDT.D and TOTAL: Comments and Price Analysis 30.03.2025
Bitcoin (BTC) and the Crypto Market In-Depth Analysis – Key Levels and Possible ScenariosThe cryptocurrency markets continue to fluctuate in parallel with Bitcoin's (BTC) movements. Especially at a time when we are questioning whether we are on the verge of a bull market, analyzing critical levels becomes extremely important. Global developments, macroeconomic factors, and technical indicators all play a crucial role in determining BTC's direction.In this analysis, we will thoroughly examine Bitcoin’s main support and resistance levels, the impact of USDT Dominance (USDT.D), the TOTAL market cap, and how macroeconomic factors influence BTC's price. BTC Support and Resistance Zones Key Support and Resistance Levels for BitcoinTo maintain its upward trend, Bitcoin must hold certain support levels. At the same time, for upward movements to be sustainable, key resistance levels must be broken.BTC Support Zones (Areas of Strong Buying Interest)$82,300 – $83,100 Range: A strong short-term support zone. This area stands out as one of the regions with intense buyer interest.$80,691 Level: The main support zone where Bitcoin has received strong buying reactions. If the price continues to hold above this level, the uptrend is expected to continue.$73,336 Macro Support Level: A critical intersection where BTC began its rise from $15,500. After this zone, BTC previously saw over 150% gains. If the price pulls back to this level, we may see renewed buying pressure.Holding above $80,691 is positive for Bitcoin, but if this level is lost, the $73,336 scenario may come into play.BTC Resistance Zones (Areas of Strong Selling Interest)$87,500 Level: One of the most critical resistance zones for Bitcoin. This level was previously a support and now acts as resistance. If BTC breaks above, the bullish scenario strengthens.$92,591 Level: One of the major resistance points that could define Bitcoin’s direction. If this level is broken to the upside, BTC could move toward the $95,745 – $97,213 zone.$95,745 – $97,213 (NPOC) Zone: A zone of high previous trading volume with unbalanced activity (NPOC). Breaking this area could lead BTC toward $110,000.$110,000 Main Target: Reaching this level could open the door to new all-time highs. Technically, once price enters discovery mode, upward momentum is likely to accelerate.A break above $87,500 strengthens the bull trend; sustained movement above $95,745 makes $110,000 the next target.Macroeconomic Factors Impacting BitcoinBitcoin’s price is not solely determined by technical levels. Global economic developments, U.S. Federal Reserve policies, inflation data, and political events all play major roles in price action.April 2 Trump Tariff Announcement:If the U.S. announces exemptions in trade policies, global risk appetite may increase, potentially allowing BTC to test $95,000.Otherwise, market uncertainty may rise, leading to short-term selling pressure on BTC.FED Interest Rate Policies and BTC:A signal of a rate cut in May by the Fed would create a positive scenario for Bitcoin.A low-interest environment increases market liquidity and accelerates inflows into risk assets like BTC.To sustain its upward move, Bitcoin must be monitored not only through technical levels but also macroeconomic developments.USDT Dominance (USDT.D) and Its Market ImpactUSDT Dominance is a key indicator showing investors’ inclination toward stablecoins. If USDT.D rises, it signals increasing risk aversion; if it falls, it indicates capital inflow into crypto assets. USDT.D Critical Levels 6.06% – Panic Selling Level:When USDT.D reaches this level, it signals investor flight from risk.A pullback from here could accelerate fund inflows into Bitcoin and altcoins.4.98% – Start of Crypto Fund Inflow:Falling below this level indicates the beginning of new capital entering the crypto market.Supports BTC staying strong around the $82,300 level.4.68% – Accumulation Zone:A zone where large investors accumulate BTC and altcoins.As long as USDT.D stays below 5.38%, $82,300 remains a strong support for Bitcoin.TOTAL Market Cap Analysis: General State of the Crypto MarketTo understand the general direction of the crypto market, we need to look at TOTAL market cap movements. TOTAL Important Levels 2.51T – Demand Zone & Strong Support:As long as we stay above this level, the crypto market maintains a positive outlook.A breakdown here could lead to sharp sell-offs in the altcoin market.2.68T – Buyer Strength Test:If buyers dominate this level, the uptrend continues.Otherwise, we could see a return to the 2.51T zone.2.84T – Main Resistance Level:A breakout here could open the door to new market highs.3.16T – Profit-Taking Zone:If the 2.86T level is broken with volume, TOTAL could climb to 3.16T.This zone may trigger a pullback, but a breakout with strong volume could lead to new all-time highs in the crypto market.If TOTAL stays above 2.51T, the market remains in a positive trend. A breakout above 2.84T confirms a bull market.Roadmap for BTC and the Crypto MarketAs long as BTC holds above $80,691, the uptrend remains intact.A break above $87,500 signals the start of a bull trend.As long as USDT.D remains below 5.38%, $82,300 remains a strong support for BTC.Macroeconomic developments (especially Trump’s April 2 announcement and Fed interest rate decisions) will determine market direction.As long as TOTAL holds above 2.51T, the market outlook remains positive.Disclaimer: This analysis does not constitute investment advice. It focuses on support and resistance zones that may present trading opportunities under current market conditions in the short and medium term. All trading and risk management decisions are the sole responsibility of the user. The use of stop-loss orders is strongly recommended.
SEC: Meme Coins Are Generally Not Securities!
There has been a major development in the cryptocurrency world. The US Securities and Exchange Commission (SEC) has announced that most meme coins will not be considered securities under federal law. This decision could be a significant turning point for crypto investors and especially the meme coin community.What Does the SEC's Statement Mean?According to the SEC's statement, popular meme coins such as Dogecoin (DOGE), Shiba Inu (SHIB) and Pepe (PEPE) generally do not fall under the definition of a security. The Commission stated that such assets are not managed by a central organization or company by nature and investors do not act directly based on a company's profit.However, the SEC also emphasized that there may be some exceptions. If a meme coin is launched by a certain group or company and investors are guaranteed a profit, it stated that such assets can be considered a security. In other words, as a general rule, meme coins are not securities, but some may be subject to scrutiny.What Will Its Impact on the Market?This statement by the SEC is considered a positive development, especially for meme coin investors. This decision may reduce the concerns investors have experienced due to regulatory uncertainty. It may also allow such assets to reach a wider adoption rate.On the other hand, this situation can also be read as a signal of softening in the SEC's approach to crypto assets in general. Recently, the SEC has concluded its investigations into crypto companies such as Gemini, OpenSea, Uniswap and Robinhood. Now, it seems to be reducing its pressure on the sector by taking a more flexible stance on meme coins.The SEC's decision not to consider meme coins as securities could be a significant turning point for the cryptocurrency market. This decision means a decrease in regulatory pressure and eliminates uncertainty in the sector to some extent. We will continue to follow the developments to see whether there will be more flexibility in the SEC's regulatory approach to crypto in the coming period.
