News
Altcoin News
Altcoin News
Browse all Altcoin related articles and news. The latest news, analysis, and insights on Altcoin.
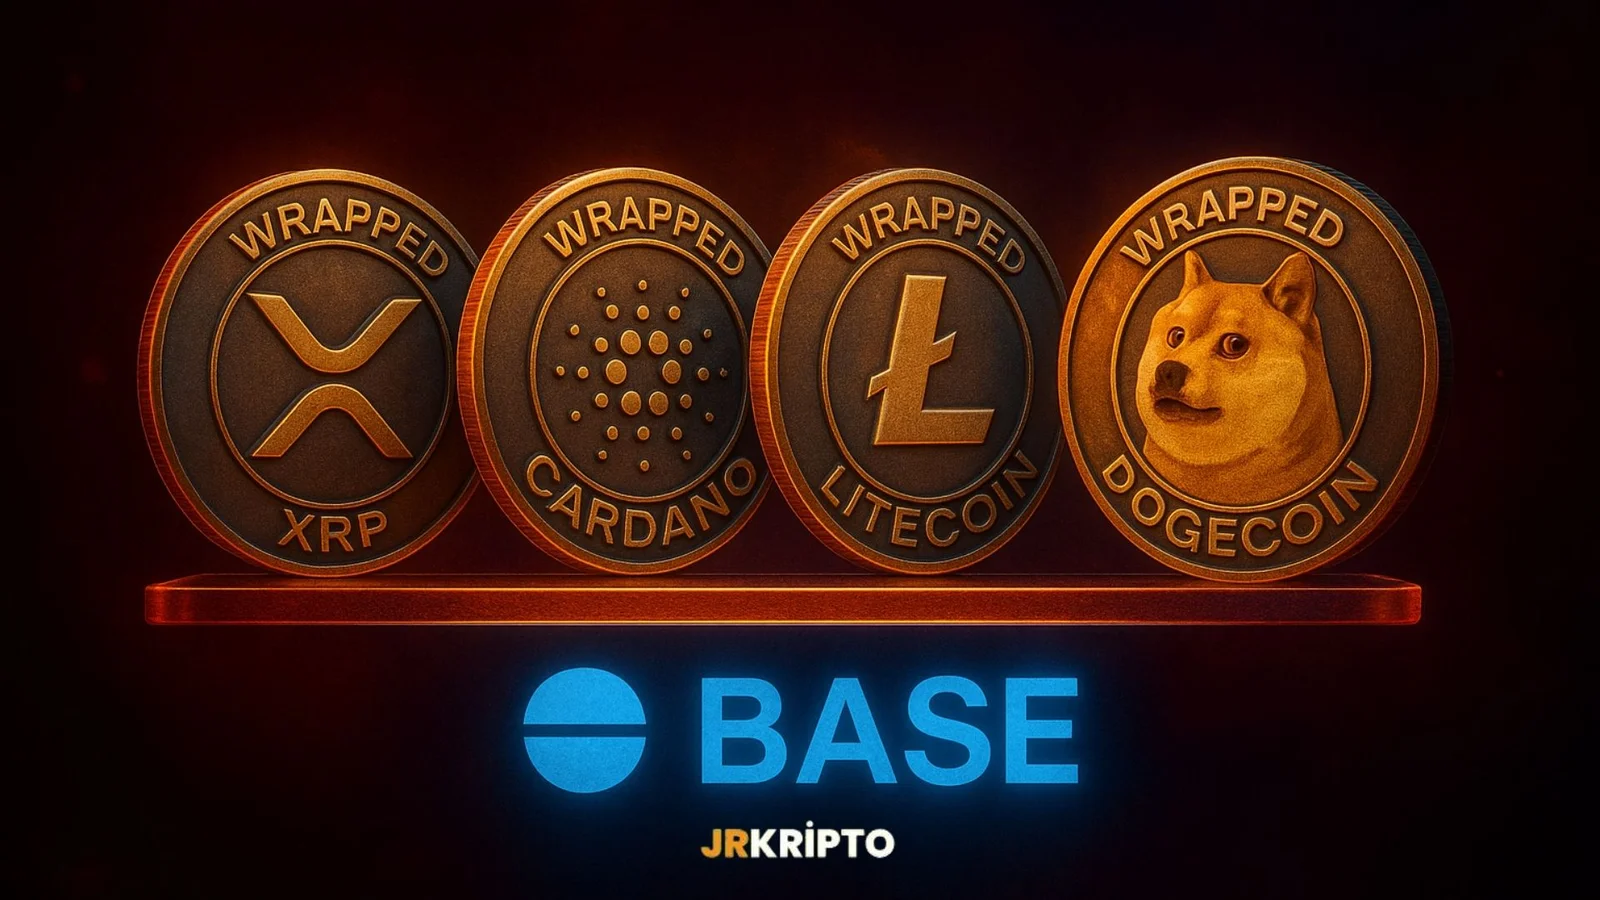
Coinbase is Preparing to Move cbADA, cbDOGE, cbLTC and cbXRP Tokens to the Base Network
U.S.-based cryptocurrency exchange Coinbase is taking a new step to increase asset diversity on its Base network. The company announced it will launch wrapped versions of Cardano (ADA), Dogecoin (DOGE), Litecoin (LTC), and Ripple (XRP) tokens on the Base network. These new assets will be named cbADA, cbDOGE, cbLTC, and cbXRP, and each will maintain a 1:1 peg to their original cryptocurrencies.These new wrapped tokens will operate similarly to Coinbase's previously launched cbBTC on the Base network. Users will lock their original ADA, DOGE, LTC, and XRP assets into smart contracts, allowing them to mint these new tokens on the Base network. Thus, these popular cryptocurrencies will become more effectively usable on the Ethereum Layer-2 Base network.Coinbase officials stated that the cbADA, cbDOGE, cbLTC, and cbXRP tokens have not yet been officially released and cautioned investors to remain vigilant against potential fraud. The tokens' official launch date will be announced in the coming days.What is the Purpose Behind This Development? Coinbase aims to enhance DeFi integration on the Base network and enable users to access decentralized applications with a broader range of assets. Moving high-volume altcoins like ADA, DOGE, LTC, and XRP to the Base network will increase liquidity and expand the use cases of applications built on Base.How Does Coinbase's Wrapped Token Model Work?Users lock an asset, for instance, ADA, into a smart contract.In exchange, cbADA is minted on the Base network at a 1:1 ratio.Users can utilize cbADA in various DeFi protocols.cbADA can be burned at any time to reclaim the original ADA.This model improves transaction efficiency and enriches the Ethereum ecosystem with additional assets.This development clearly underscores Coinbase's commitment to the Base network and its growth ambitions within decentralized finance. With the introduction of these new tokens, Coinbase users can utilize assets like ADA, DOGE, LTC, and XRP with much greater flexibility.
WLD Comments and Price Analysis 13 May 2025
Worldcoin (WLD) Technical AnalysisWLD has recently demonstrated a highly impressive upward performance. This movement, which began in early April, gradually climbed from the $0.60 level and pushed the price above $1.30. During this period, both the rising trendline and Fibonacci support levels functioned effectively. It is currently holding within the $1.162–$1.226 range, which it initially failed to break, later did so, and then confirmed as support via a retest and SR flip. WLD Current Outlook The rising trendline seen on the chart indicates that WLD is ascending in a healthy, step-by-step fashion and carries strong buying momentum. The current pullback can be interpreted as a technically normal and healthy breather.Support Levels:$1.226 – $1.162: Critical support zone$1.000: Strong psychological and technical support$0.861 – $0.816: Supports that may come into play in the event of deeper correctionsResistance Levels:$1.300 – $1.330: Short-term price resistance currently being tested$1.446: A resistance level that may be targeted in the medium termVolume-backed breakouts in these zones will be critical to triggering the next leg of the price rally. Otherwise, WLD could pull back into the $1.16 – $1.00 range. However, the overall trend structure remains positive.In conclusion, WLD presents a strong outlook both in terms of technical structure and rising trend. As long as it maintains support above $1.226, new highs are within reach. Especially closes above $1.30 could position $1.446 as the next target for WLD. The key risk in this process is a breakdown of the rising trend. However, the current structure indicates that this scenario has not yet materialized.These analyses do not constitute investment advice and focus on support and resistance levels believed to potentially create trading opportunities in the short to medium term based on market conditions. However, all responsibility for trading and risk management lies entirely with the user. The use of stop-loss orders in all shared trades is strongly recommended.

ZK Comments and Price Analysis 13 May 2025
ZK (zkSync) Technical AnalysisZK (zkSync) has finally broken out of its long-standing downtrend to the upside. In particular, after the strong breakout above the $0.0551 resistance level with significant volume, the price accelerated rapidly, climbing to $0.0796. This suggests that buyers have regained control in the short term. As of now, the price is consolidating at $0.0744, and it is being monitored whether previous resistance levels are now being tested as support. ZK Current Breakdown The structure formed after this breakout may technically indicate the beginning of a new upward wave. However, for this uptrend to be sustainable, the price needs to hold the $0.0675–$0.0637 zone and also break above the $0.0796 resistance with strong volume.Support Levels:$0.0675 – $0.0637: Support-resistance flip (SR Flip)$0.0551: Major supportResistance Levels:$0.0796: Current strong resistance and the area where the price has stalled$0.0938 – $0.0995: Medium-term target zone$0.1193: Major long-term resistance to watchThe breakout on the chart followed by a strong rally reveals that buyers have stepped in aggressively. While the RSI indicator supports the upward movement, a short-term correction should not be ruled out. Therefore, it is advisable for investors to closely observe price behavior around the support levels.In conclusion, ZK has clearly broken above its descending trendline, giving a technically positive signal. Movement above the $0.0551 level suggests that higher targets may come into play in the medium term. If we see sustained closes above $0.0796, the price could potentially move toward $0.0938 and then above $0.10. Otherwise, the $0.0675 – $0.0630 range may be retested. However, the current structure indicates that the bullish scenario is more likely.This analysis does not constitute investment advice. It focuses on support and resistance levels that are considered to potentially offer trading opportunities under current market conditions in the short to medium term. However, the responsibility for making trades and managing risk lies entirely with the user. The use of stop-loss orders in any shared trades is strongly recommended.

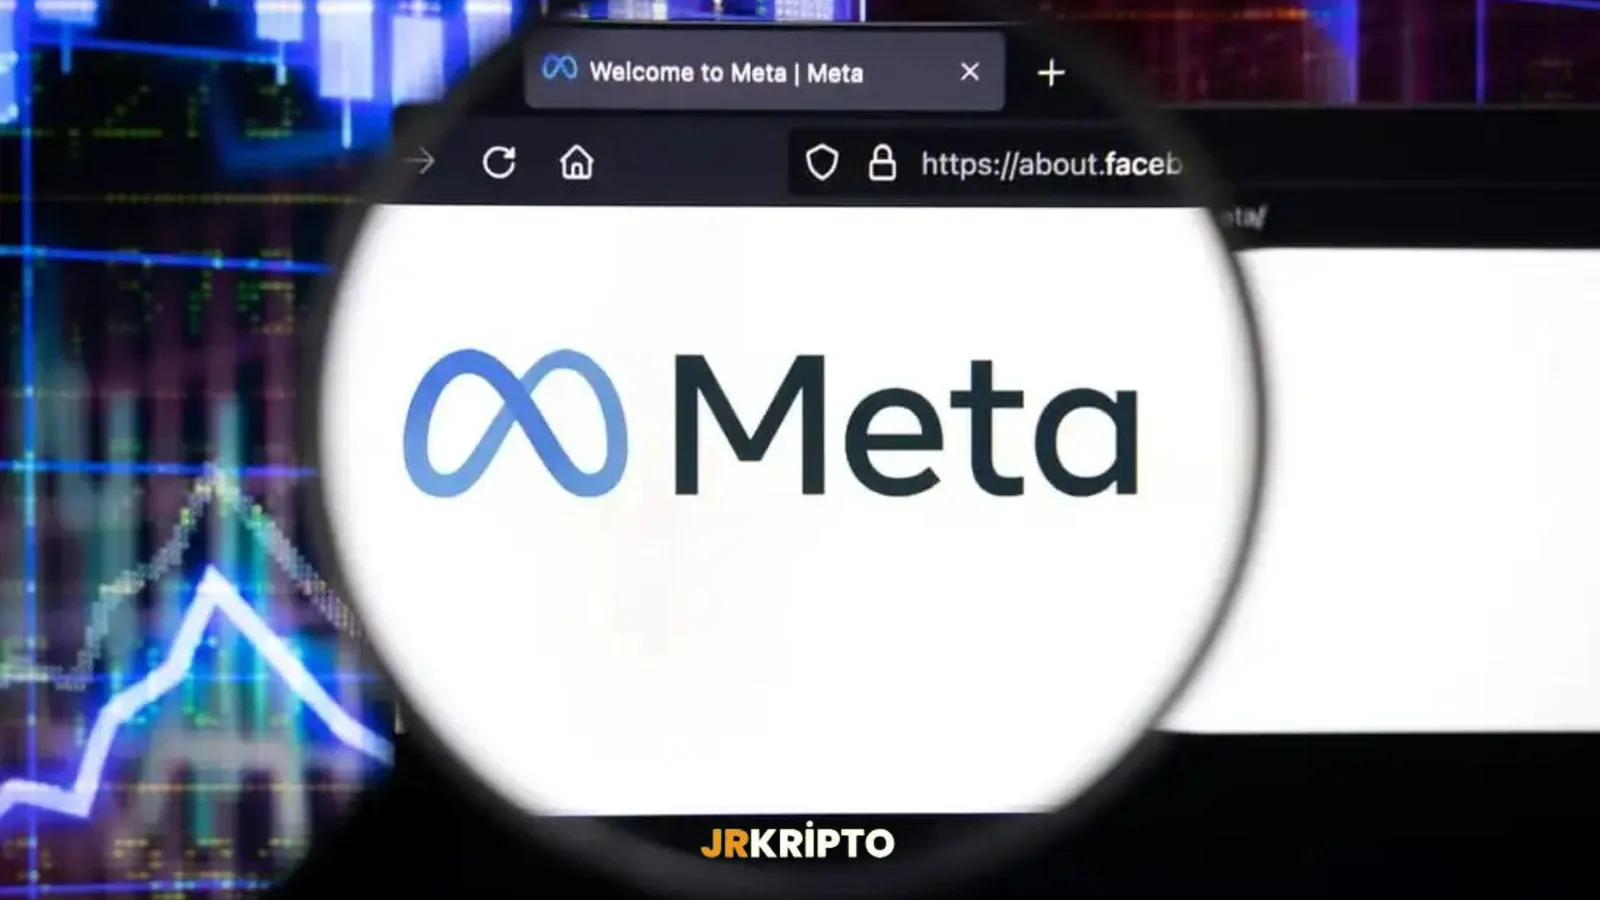
Meta's New Crypto Plan: Tether and USDC Can Be Integrated into Payments
Meta is preparing to return to the crypto world after a three-year break. It is now reported that the company is in talks with various crypto infrastructure firms to launch stablecoin-supported payments on its platforms. This development is a significant signal for both the crypto market and global payment systems.Meta’s Strategic ComebackAccording to a report by Fortune, Meta is working on a model where popular stablecoins like Tether’s USDT and Circle’s USDC can be integrated as multiple tokens. This step specifically aims to make micro-payments to content creators through platforms like Instagram and WhatsApp faster, cheaper, and more efficient.The new payment initiative is being led by Ginger Baker, who has experience in the fintech and blockchain world. Meta currently describes the process as being in “learning mode,” but the scale of the steps being taken shows that this transformation is not superficial but rather a long-term strategic move.Stablecoin Race: Tech Giants on the FieldMeta is not alone in this field. Recently, many major finance and tech companies have entered the stablecoin space:On May 7, Visa invested in the stablecoin venture BVNK.Stripe launched stablecoin-based accounts in over 100 countries.World Liberty Financial (WLFI) launched the USD1 stablecoin pegged to the U.S. dollar in March. In just two months, it became the seventh-largest stablecoin by market value.U.S. Treasury Secretary Scott Bessent summarizes this trend clearly:“Stablecoins are a great opportunity to increase the dollar’s dominance in the digital world.”However, this growth is being affected by a lack of regulation. On May 8, Democratic senators blocked the Genius Stablecoin Act, delaying the regulation process.Why Is This So Important?The fact that a tech giant like Meta is working on stablecoin integration significantly strengthens the potential for daily use of cryptocurrencies. This is not just a change in payment methods; it also provides four critical contributions that could increase the use of stablecoins in everyday life:Low transaction costs: Bank fees are eliminated.Instant and cross-border transfers: Global content creators can receive payments instantly.Growth of in-platform economy: Revenue models in apps like Instagram and WhatsApp will be reshaped.Digital financial inclusion: Offers opportunities for users without traditional bank accounts.Digital Payments Cross a New ThresholdThe step Meta is about to take could be transformative not only for its own platforms but for the entire crypto ecosystem. Stablecoins are no longer just an “experiment”; they are preparing to become a mainstream tool in global payment systems.As regulations become clearer and tech companies take more steps in this area, the idea of “paying with crypto” will no longer be the future—it will be today’s reality.
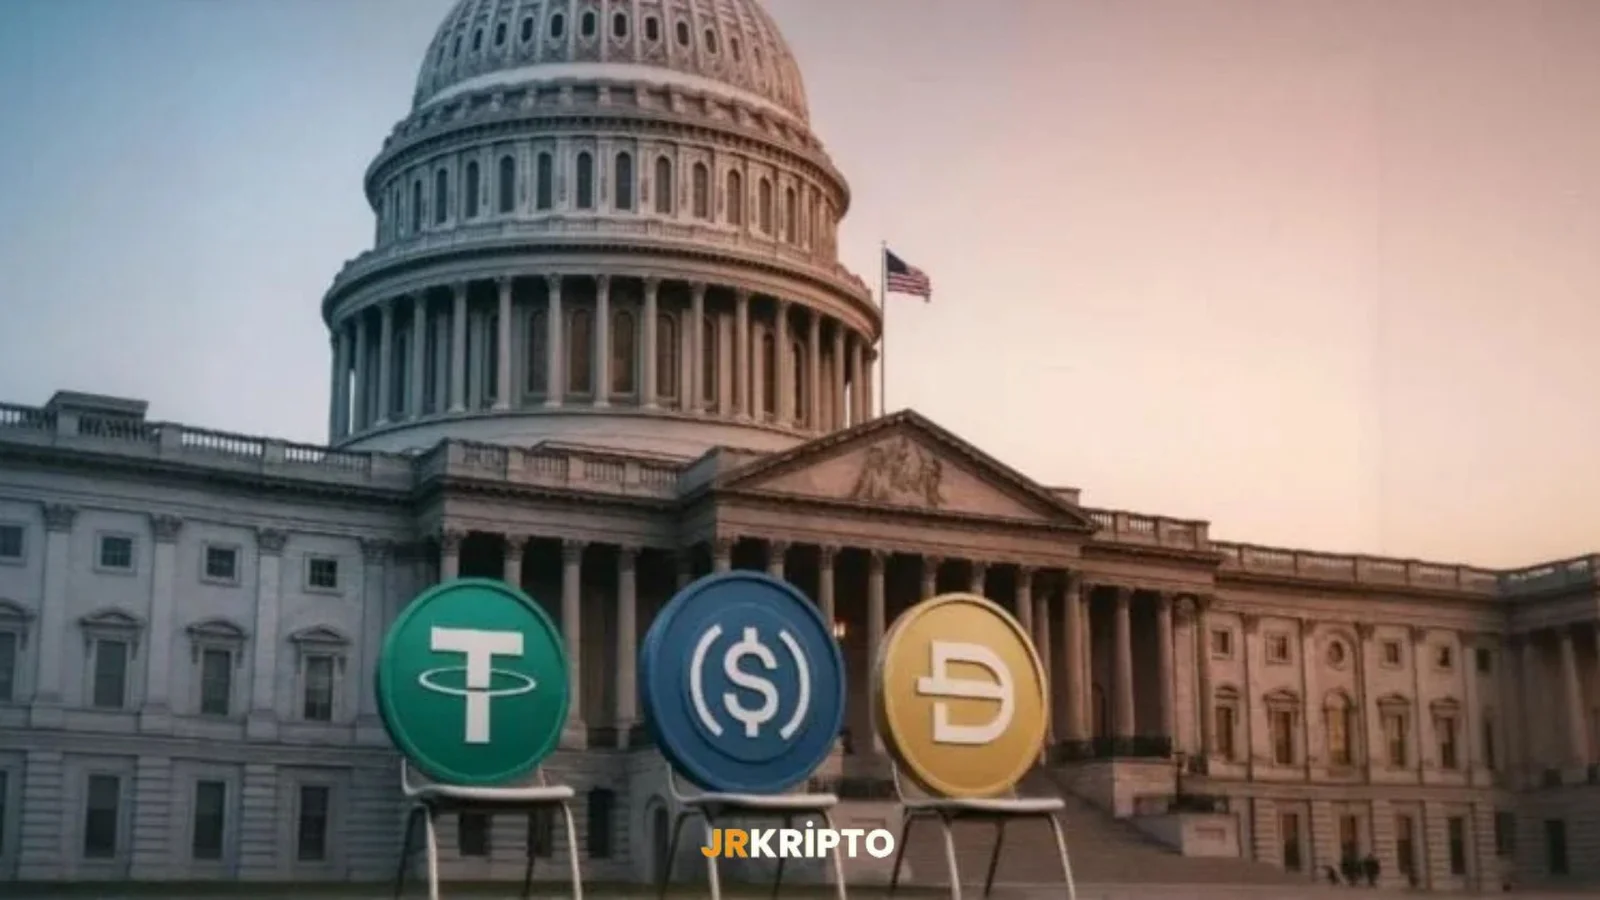
What Does the Genius Stablecoin Law Mean?
A newly introduced bill in the United States has opened the door to a major transformation in the crypto world. Called the “Genius Stablecoin Act” (GENIUS Act), this bill particularly concerns stablecoin issuers like Tether (USDT). The law foresees that Tether, regardless of where it is headquartered, will now be subject to U.S. laws. This is a critical development not just for Tether but for the entire global stablecoin sector.Tether to Be Subject to U.S. RegulationsThe most notable clause in the new bill is the principle of “extraterritoriality,” which includes foreign companies within the jurisdiction of the United States. In other words, every stablecoin issuer that serves users in the U.S.—even if their headquarters are abroad—will now be required to comply with American regulations. Tether, which is based in El Salvador, will be directly affected by this regulation.Tether CEO Paolo Ardoino stated that they view this initiative positively and aim to maintain a constructive collaboration with U.S. regulators. However, the company will now have to comply with stricter reporting and transparency rules.What Does the GENIUS Act Bring?According to the bill, stablecoin-issuing companies will face the following regulations:1:1 Reserve Requirement: Every stablecoin must be fully backed by assets such as U.S. dollars or short-term Treasury bills.Licensing and Supervision: Projects over $10 billion will be federally licensed, while smaller ones will be licensed at the state level.AML/KYC Compliance: All issuers will be subject to anti-money laundering and know-your-customer rules.Regular Reporting: Monthly reserve reports and annual independent audits will be required.Although it is not yet certain whether the GENIUS Act will become law, the framework it proposes signals the beginning of a period where stricter rules will dominate the stablecoin market. As the U.S. continues its efforts to expand influence in this area, a new adaptation process may begin for giants like Tether. During this process, both investors and industry players will have to be more prepared for regulatory uncertainties.
Eric Trump: It's Time to Change the Broken System with WLFI
Eric Trump once again drew attention with his appearance at the TOKEN2049 conference held in Dubai on May 8, 2025. Making headlines in the crypto world, Trump introduced a new project called World Liberty Financial (WLFI) and clearly expressed his confidence in both this project and Bitcoin.According to Trump, World Liberty Financial aims to repair and reshape the current "broken" financial system. Built on decentralized finance (DeFi) principles, the project seeks to enable users to carry out financial transactions with peace of mind, without relying on intermediaries like banks.WLFI’s stablecoin, USD1, is backed by U.S. Treasury bonds and cash equivalents. This digital asset will operate on the Tron blockchain and will be used in a $2 billion strategic investment by Abu Dhabi-based investment firm MGX into Binance. This step indicates that WLFI is not just another DeFi project, but one that will play an active role in international capital flows.In Trump’s words: “Wait for the next two months and see what happens. WLFI will be one of the fastest-growing crypto projects.”“Bitcoin Is Digital Gold — And the Trump Family Owns a Lot of It”WLFI wasn’t the only topic discussed at the conference. Eric Trump also shared his views on Bitcoin, stating, “I love Bitcoin. I believe it’s digital gold,” and revealed that both he and his father, Donald Trump, own a significant amount of Bitcoin.According to Trump, Bitcoin will experience exponential growth in the coming years. This remark is not just an investment prediction; it also shows that the Trump family views cryptocurrencies as a long-term strategic asset class.A Political Perspective on CryptoThe WLFI project carries not only financial but also political significance. The Trump family’s interest in crypto assets signals that the U.S. should take a more active role in the digital asset ecosystem. Projects like WLFI support decentralization and offer alternative pathways to traditional financial institutions.In conclusion, Eric Trump’s appearance on the TOKEN2049 stage in Dubai highlighted the potential of World Liberty Financial and once again reinforced the Trump family’s position in the crypto market.

ARB Comments and Price Analysis 7 May 2025
ARB Technical AnalysisARB has finally broken out of its long-standing downtrend, marking a significant technical milestone. Following this breakout, the price climbed to $0.3529, but failed to sustain that level and pulled back toward the $0.30 zone — a key test area for market participants.The current level at $0.3016 serves as both a psychological and technical support. Holding this area could open the door for a renewed bullish wave. However, if it fails, the breakout may be seen as a false move, increasing selling pressure once again. Support Levels:$0.3012–$0.2892: Current support zone and post-breakout retest area$0.2560: Main support if downside continues$0.2430: Liquidity zone and major long-term supportResistance Levels:$0.3128–$0.3228: First major resistance and decision area$0.3529: Previous high and short-term market structure break (MSB)$0.3858–$0.3982: Mid-term resistance target zoneThe chart shows that while the downtrend has been broken, buyers haven’t yet shown strong follow-through volume. RSI indicates a recovery from oversold territory, but momentum needs confirmation. If ARB holds above support and breaks $0.3228, it could build a more bullish structure. Otherwise, the price may fall back into the previous channel.Conclusion: ARB has delivered a positive technical signal by breaking its descending trendline. However, sustaining this breakout depends heavily on maintaining support above $0.30. If it holds, short-term targets include $0.35, followed by $0.40. If support fails, stop-loss strategies may become essential for risk management.Disclaimer: This analysis does not constitute investment advice. It focuses on support and resistance levels that may present potential short- to mid-term trading opportunities depending on market conditions. However, all responsibility for trading decisions and risk management lies entirely with the user. The use of stop-loss orders is strongly recommended for any trade setup shared.

TOTAL, ETH/BTC: Comments and Price Analysis 7 May 2025
Crypto Market at the 2025 Peak: Will the Bull Continue After the FOMC? [Detailed TOTAL Analysis]Technical Structure: Historical Resistance Zone and 5-Year TrendThe 2.85T – 2.95T USD region is the peak of the 2021 bull season. This zone acts as a macro resistance line that has not yet been broken. Currently, we are seeing weekly closes just below this line. This indicates that the market is at a critical decision point regarding this level. TOTAL Below that, around 2.15T USD, lies the ascending trend support that has been in place for 5 years. This trend line is essentially the backbone of the bull cycle that started after the pandemic and is still valid today.This structure tells us two things:a) Either the market will clearly break through the 2021 peak and initiate a new super bull,b) Or it will once again get rejected in this region and pull back to major supports to regain strength.Despite short-term declines, the weekly structure shows that ETH is still preparing for a mid-term upward move.Post-FOMC Expectations on May 7: Blue and Red ScenariosBlue Scenario (Positive FOMC → New Bull Wave)In this scenario, if the FED uses a non-hawkish tone in the May 7 meeting, leaves the door open for rate cuts, and emphasizes that "sufficient tightening has been achieved" in the fight against inflation, risk markets could respond with great enthusiasm.In this case, the 2.85T region on the chart would be clearly broken, followed by a healthy retest of that region. Then, the market could head toward the 3.35T USD and higher targets. If this is supported by developments like the Ethereum Pectra Upgrade and spot altcoin ETF applications, we could witness the strongest rally since 2021.Let’s not forget: historically, low volatility + positive divergence after an FOMC has often been the trigger for major bull runs.Red Scenario (FOMC Uncertainty or Short-Term Pressure)In this scenario, even if the FED keeps rates steady, if it uses cautious language regarding inflation, or if markets interpret that "rate cuts are not imminent", or if the 2.85T – 2.95T line cannot be decisively broken; rejection and correction become more likely.Here, the market could first pull back to the 2.65T region, and possibly to the 2.15T – 2.00T zone around the main ascending trend. Such pullbacks often generate high demand in POI (Point of Interest) regions. Especially the trend line zone could, as in the past, serve as an accumulation zone for large funds.However, even in this scenario, the bull structure remains intact. We’re merely talking about a correction to regain balance and market saturation.Macro Trend Continues: 5-Year Support Still IntactThe most important positive signal is that the 5-year ascending trend is still valid.There hasn’t been a single weekly close below this trend.Even in the harshest sell-offs of the 2022 bear season, this trend was preserved.Where we stand today, there’s a structure squeezed between this trend and the 2021 peak. This structure typically indicates an “expansion after compression” model. By nature, such squeezes in bull markets usually break to the upside. If the fundamental triggers listed above (ETFs, rate cut signals) come into play, this breakout could initiate a new ATH wave.ETH/BTC Chart: Historical Lows in Favor of Ethereum ETH/BTC Now let’s look at this structure from the ETH/BTC perspective. The ETH/BTC ratio is currently at levels seen before Ethereum’s major surge in 2021. This ratio is at historical low levels, meaning Ethereum has high potential to gain value against BTC.Considering both Ethereum’s technical structure and ETF speculation, this structure suggests that the altcoin season may start under Ethereum’s leadership. In summary, we are in a structure where Ethereum may gain value not only in USD terms but also against BTC in the coming weeks.Conclusion: A Market Awaiting Bull ConfirmationThe market is still within a macro upward trend.Price is struggling with historical resistance.If the blue scenario kicks in post-FOMC, a new super bull season may begin.The red scenario still points to a healthy correction; as long as the trend isn't broken, the bull structure remains.ETH/BTC is open to strengthening in favor of Ethereum.Therefore, the market is closer to the positive scenario. With a breakout above this region, which represents the 2021 peak, we could see a total market cap of first 3.35T and then 4.0T in the short term.These analyses, which do not provide investment advice, focus on support and resistance levels where short and medium bid trading opportunities can be created according to market conditions. However, the user is solely responsible for trading and risk management. In addition, it is strongly recommended to use stoploss in relation to replacement transactions.

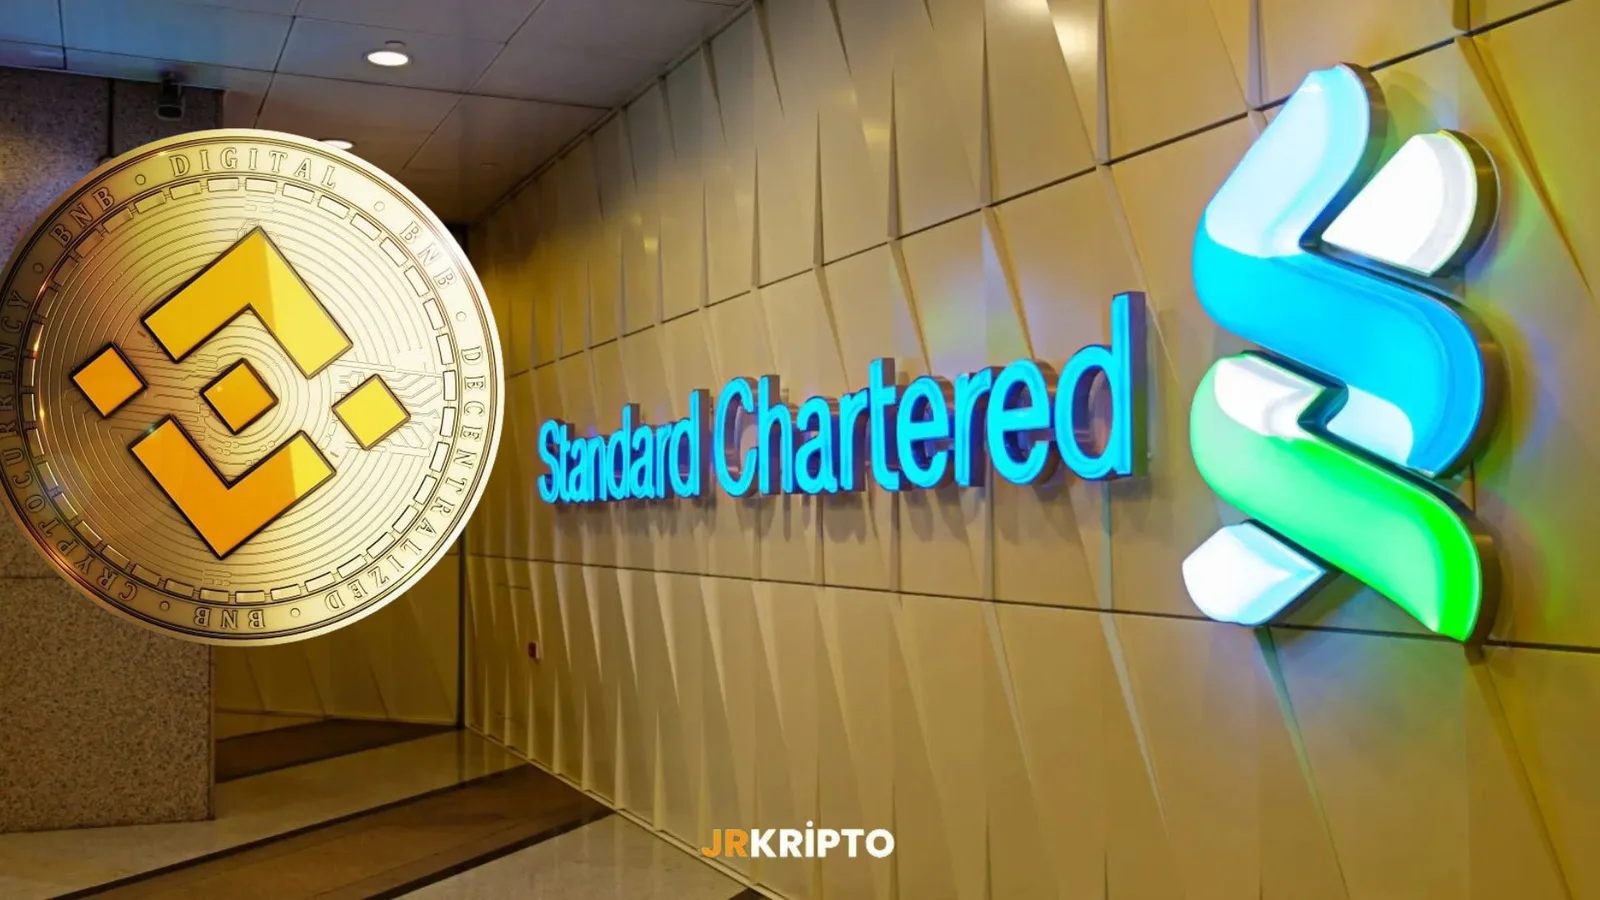
Standard Chartered: BNB 2028 up to $ 2.775 can reach
In a new report published on May 6, 2025, Standard Chartered Bank predicted that Binance's local token, BNB, could rise to $ 2,775 by the end of 2028. This forecast marks an increase of about 360% from the price level in the current $ 600 band.Background of the Forecast: Correlation with Bitcoin and EthereumGeoff Kendrick, Head of Digital Asset Research at Standard Chartered, points out that BNB's performance is moving in parallel to an equally weighted basket of Bitcoin and Ethereum. If this correlation continues, it is stated that the BNB price could reach $ 2,775 by 2028. Kendrick especially emphasizes that Binance's central position in the crypto ecosystem is decisive in this price projection.BNB Chain and Ecosystem ImpactBNB Chain is actively used in areas such as decentralized finance (DeFi), lending protocols and liquid staking. This structure distinguishes it from competitors such as Ethereum and Avalanche. Standard Chartered points out that BNB Chain offers a "traditional" smart contract infrastructure and this infrastructure contributes to the long-term value of BNB.In addition, the report states that BNB has a "rich" market value in proportion to the economic activities on the chain thanks to its deflationary token structure and direct connection with Binance.Standard Chartered's BNB forecast offers market participants both an optimistic view and indicates that the price increase depends on Binance's performance. The report reveals that BNB is not as "independent" as Bitcoin and Ethereum, but it still has significant potential.Over the years, the general direction of the crypto market and Binance's compliance with regulations will play an important role in determining the future of BNB prices.
ALT Comments and Price Analysis 6 May 2025
AltLayer (ALT) Technical AnalysisAltLayer (ALT) continues to move within a descending channel pattern, with the price currently trading near the lower boundary at $0.02608. Following a period of low-volume selling pressure, ALT has once again slipped toward the channel base — marking a technically crucial level. ALT Falling Channel The lower band of the channel, which has historically served as a strong bounce zone, is being closely monitored by traders. The $0.02600–$0.02100 range stands out as both a psychological and technical support zone. If the price manages to hold this area, a rebound toward the channel’s upper boundary becomes more likely, signaling a potential short- to mid-term recovery.However, if the channel support fails and the price closes below $0.02100, the market may enter a deeper correction phase with possible new lows.Key Technical LevelsSupport Zones:$0.02600–$0.02100: Major support zone near the channel bottom$0.01750: Final support line within the descending channelResistance Zones:$0.03760: Short-term resistance and liquidity zone$0.04748–$0.05217: Mid-term resistance band$0.06798: Short-term market structure break (MSB) level$0.08859–$0.09734: Resistance-turn-support (SR Flip) region$0.13030: Potential reaction zone after a confirmed breakoutPrice action over the coming days will likely be defined by how ALT reacts within the $0.02600–$0.02100 support zone. A strong bounce with volume could revive bullish momentum, while a failure to hold this range might lead to a breakdown below the channel.Conclusion: AltLayer is currently positioned at a technically sensitive area. Proximity to the channel’s lower boundary presents a potential reversal opportunity, but also carries the risk of deeper downside if support fails. The $0.02100 level acts as a last-resort threshold. On the upside, if the price bounces, the first target is $0.03760, followed by $0.04748–$0.05200 as a mid-term objective. For buyers, this zone offers a compelling risk-reward setup.Disclaimer: This analysis does not constitute investment advice. It focuses on support and resistance levels that may present potential short- to mid-term trading opportunities depending on market conditions. However, all responsibility for trading decisions and risk management lies entirely with the user. The use of stop-loss orders is strongly recommended for any trade setup shared.

Kyrgyzstan's New Roadmap: Is the Era of Bitcoin and BNB Coming in Reserves?
A news that has attracted attention in the crypto world has come from Central Asia. The founder of Binance, CZ, namely Changpeng Zhao, joined the country's National Crypto Committee at the invitation of Kyrgyz President Sadyr Japarov and made a very sound proposal: Bitcoin (BTC) and Binance Coin (BNB) should be used for national reserves.This proposal was suddenly asked, “Is Kyrgyzstan stepping into its digital future so fast?” he raised the question.What Does It Mean to Hold Reserves with Crypto?According to CZ, crypto assets such as BTC and BNB can be the reserve assets of not only individual investors, but also states. This would be a big step for developing countries such as Kyrgyzstan. It both creates an alternative in the fight against inflation and becomes a powerful symbol in the transition to a digital finance system.In line with this vision, there is a memorandum of understanding signed on April 3. This document is not just a statement of intent, it has concrete goals ranging from blockchain education to digital pay systems.Binance Pay Comes to Life in KyrgyzstanAccording to the agreement, Binance Pay will be actively used in the country. In other words, people in Kyrgyzstan will be able to do their coffee and grocery shopping with crypto. This is a development that will lead the region, especially in the field of digital pay systems.A system is being considered that everyone can use, from tourists to local residents. When safety and speed are also involved, there is no reason why this system should not hold.Transformation Supported by EducationBut technology alone is not enough. Information is needed for this transformation to stand. This is where Binance Academy comes into play. The goal is not just to use blockchain, but to produce it. Educational programs are planned for everyone from public servants to students. Kyrgyzstan wants to be not only a consumer, but also a developer.Digital Som and Crypto ReservesAnother important development is the "digital som." Kyrgyzstan's official digital currency is now legal. In other words, the CBDC (Central Bank Digital Currency) is now on constitutional ground in this country. Binance is also supporting this project in a technical sense.On top of that, the evaluation of BTC and BNB as a national reserve instrument is also on the agenda. If this comes to life, Kyrgyzstan will be the first country in Central Asia to use crypto at this level.What Does Kyrgyzstan Want to Do?Let's put it simply, he wants to be ready for the finance of the future and to diversify his economy. By collaborating with global figures such as CZ, it makes this not only a technology investment, but also a matter of prestige.When these steps taken by Kyrgyzstan are referred to as ‘digitalization’, it reminds us that not only infrastructure, but also vision and courage are required. Holding Bitcoin in reserves or buying coffee with crypto on the street may seem radical for today. But the world is changing rapidly. And this time the change may be starting from Bishkek.

SUI Comments and Price Analysis 3 May 2025
SUI Technical AnalysisSUI has once again drawn investor attention by rising nearly 60% in a short time following strong buying at the $2.07 level.The current price is around $3.34, and the chart shows that this rise is technically built on a solid foundation.SUI has maintained its ascending channel structure that has been ongoing since mid-2023.In particular, $2.95 is the first support level where a reaction can be expected during pullbacks, and it holds critical importance as a support-resistance flip (SR Flip) from the previous rally.The reaction that followed the pullback to this region confirms that the uptrend is technically healthy. SUI Rising Channel Technical LevelsSupport Zones:$2.95 → Closest critical support to the current price$2.29 – $2.07 → Previous horizontal support and breakout zone$1.55 → Main support near the lower band of the channel$1.16 – $1.05 → Major supportResistance Zones:$3.80 – $4.00 → Previous peak and psychological resistance zone$4.65 – $5.00 → Upper band of the ascending channel and short-term target areaLooking at the channel structure on the chart, SUI is still moving within an uptrend.Especially the recent breakout and subsequent volume-backed rise show that this channel is not only being maintained but also being validated by investors.As long as SUI maintains stability above the $3.00 – $3.10 region, upward expectations may continue.Within this structure, the first target is $3.80 – $4.00, followed by the $5.00 zone, which is the upper band of the channel.In summary, SUI continues to move within a technically strong channel.Especially the recent price action shows that it is supported by investors.As long as the channel structure is preserved, SUI's upside potential continues to grow.These analyses do not constitute investment advice.They focus on support and resistance levels that are believed to provide short- and medium-term trading opportunities based on market conditions.However, all trading and risk management responsibility lies entirely with the user.Stop-loss usage is strongly recommended for any trades mentioned.

TON of Comments and Price Analysis 3 May 2025
TONToncoin (TON) has recently returned to investors’ radar thanks to its strong recovery in recent weeks.The price is currently trading at $3.122 and is approaching the upper band of the descending channel structure.A breakout at this level could signal a trend reversal in the medium term.The overall structure on the chart is still forming within a descending channel.However, the recent upward wave and a series of higher lows indicate that this channel now has potential for a breakout. TON Falling Channel Technical LevelsSupport Zones:$3.067: Short-term support$2.897: Strong support zone in case of a pullback$2.550: Major supportResistance Zones:$3.444 – $3.610: Main target for a breakout$4.118: First strong resistance likely to be tested after a breakout$4.699 – $4.924: Major resistance$5.694: Long-term target levelThe price is currently near the upper band of the channel.If an upward breakout occurs from here, the downtrend can be considered over, and Toncoin’s price may move back toward the $4+ region.However, if the zone is not broken and a rejection occurs, the price may pull back toward the $2.90 support levels.Therefore, closing prices over the next few days will be quite decisive.If the $3.44 – $3.61 zone is broken, the trend reversal will be confirmed.In case of an upward breakout, the first target is $4.12, followed by the $4.92 region.If rejected downward, the $3.06 and $2.89 support levels should be monitored.In summary, Toncoin has now approached the upper boundary of the descending channel in which it has been moving for a long time.Now, all eyes are on whether this channel will be broken.If the price decisively breaks above $3.61 with volume, it could indicate that a new uptrend has begun.In the opposite scenario, a short-term correction may be inevitable.These analyses do not constitute investment advice.They focus on support and resistance levels that are believed to offer short- and medium-term trading opportunitiesdepending on market conditions.All trading and risk management responsibilities lie entirely with the user.Stop-loss usage is strongly recommended for any trades mentioned.

APT Comments and Price Analysis 2 May 2025
APTAptos (APT) has broken upward from the descending channel structure in which it has been priced for a long time, giving a clear signal of change in the technical outlook.The price is currently trading around $5.487, indicating that the $5.38 resistance level has been surpassed, possibly signaling the start of a new upward wave.Channel breakouts are strong indicators of trend reversal in technical analysis.In particular, the formation of higher lows in recent weeks and volume-supported upward moves suggest that this breakout is not just a “reaction” but a structural reversal. Falling Wedge Fracture Support and Resistance LevelsSupport Zones:$5.380: Support-resistance flip (SR Flip)$5.000 – $4.800: Demand zone to monitor during pullbacks$4.200 – $3.900: Major supportResistance Zones:$6.204 – $6.572: First major target zone$7.725: Broad time-frame resistance area$9.081 – $9.620: Psychological resistance$11.496: Long-term major resistanceWith APT breaking above the descending channel, the technical outlook has clearly changed.The trend direction has now turned upward, and each new rise is being supported by a higher high than the previous one.If the price holds above this level, it is technically possible for it to climb first to the $6.20 – $6.57 range, and then to $7.72.If the price maintains stability above $5.38, it could move towards the $6.20 – $6.57 band and later towards $7.72.Closures below $5.00 could weaken the bullish scenario in the short term.Volume-supported new breakouts could accelerate the upward movement.In summary, APT Coin has given a strong technical signal of change by breaking out of the descending channel structure.The break above $5.38 and staying above it indicates that the bullish scenario has now become the main expectation.In the coming days, the $6.20 – $6.57 range should be followed as a critical target.These analyses do not constitute investment advice.They focus on support and resistance levels that are believed to offer short- and medium-term trading opportunitiesdepending on market conditions.All trading and risk management responsibilities lie entirely with the user.The use of stop-loss is strongly recommended for any shared trade ideas.

ID Comment and Price Analysis 1 May 2025
IDSpace ID (ID) has finally reached an important technical level in its long-running decline channel. The price is currently trading at the level of $ 0.2144 and has touched the upper band of the falling channel. This region has caused sales pressure many times before; however, the picture may be a little different this time.When we look at the technical structure, the price has climbed above the channel by creating higher bottoms since the last bottoming zone. ID Current Support and Resistors Support Zones:0.1950 – 0.1750 $: Short-term support $0.1570: Major supportResistance Zones:$0.2164: Channel upper band – the main resistance being tested at the moment0.2551 – 0.2727 $: The first target after the breakdown$0.3287: Medium-term strong resistance$0.3962 – $0.4234: Long-term major resistance area$0.5202: Psychological resistance The recovery movement that ID has shown in recent weeks indicates a technically strong structure. In particular, the fact that the price dips higher within the falling channel indicates that buyers are returning to the scene again. In the current outlook, the breaking of the channel upper band of $ 0.2164 may be a technical turning point for ID.With this breakage, the falling trend will come to an end and a more positive pricing process may begin in the short-medium term. exceeding the $0.2164 level with daily closures means a technical break. If this happens, the first targets will be: $ 0.2550 and then $ 0.2727 levels. In the possible rejection scenario, the 0.1950 support should be followed; if this region is lost, the trend may weaken again.In summary, the ID is located at the critical threshold of the falling channel structure. Technically, the positive signals have been strengthened. If the $0.2164 level is exceeded, the falling trend will end and a brand new bullish phase may begin for ID. That's why it's critical for investors to keep a close eye on the next few days.These analyses, which do not offer investment advice, focus on support and resistance levels that are thought to create trading opportunities in the short and medium term according to market conditions. However, the responsibility for making transactions and risk management belongs entirely to the user. In addition, it is strongly recommended to use stop loss in relation to shared transactions.