News
Politics News
Politics News
Browse all Politics related articles and news. The latest news, analysis, and insights on Politics.
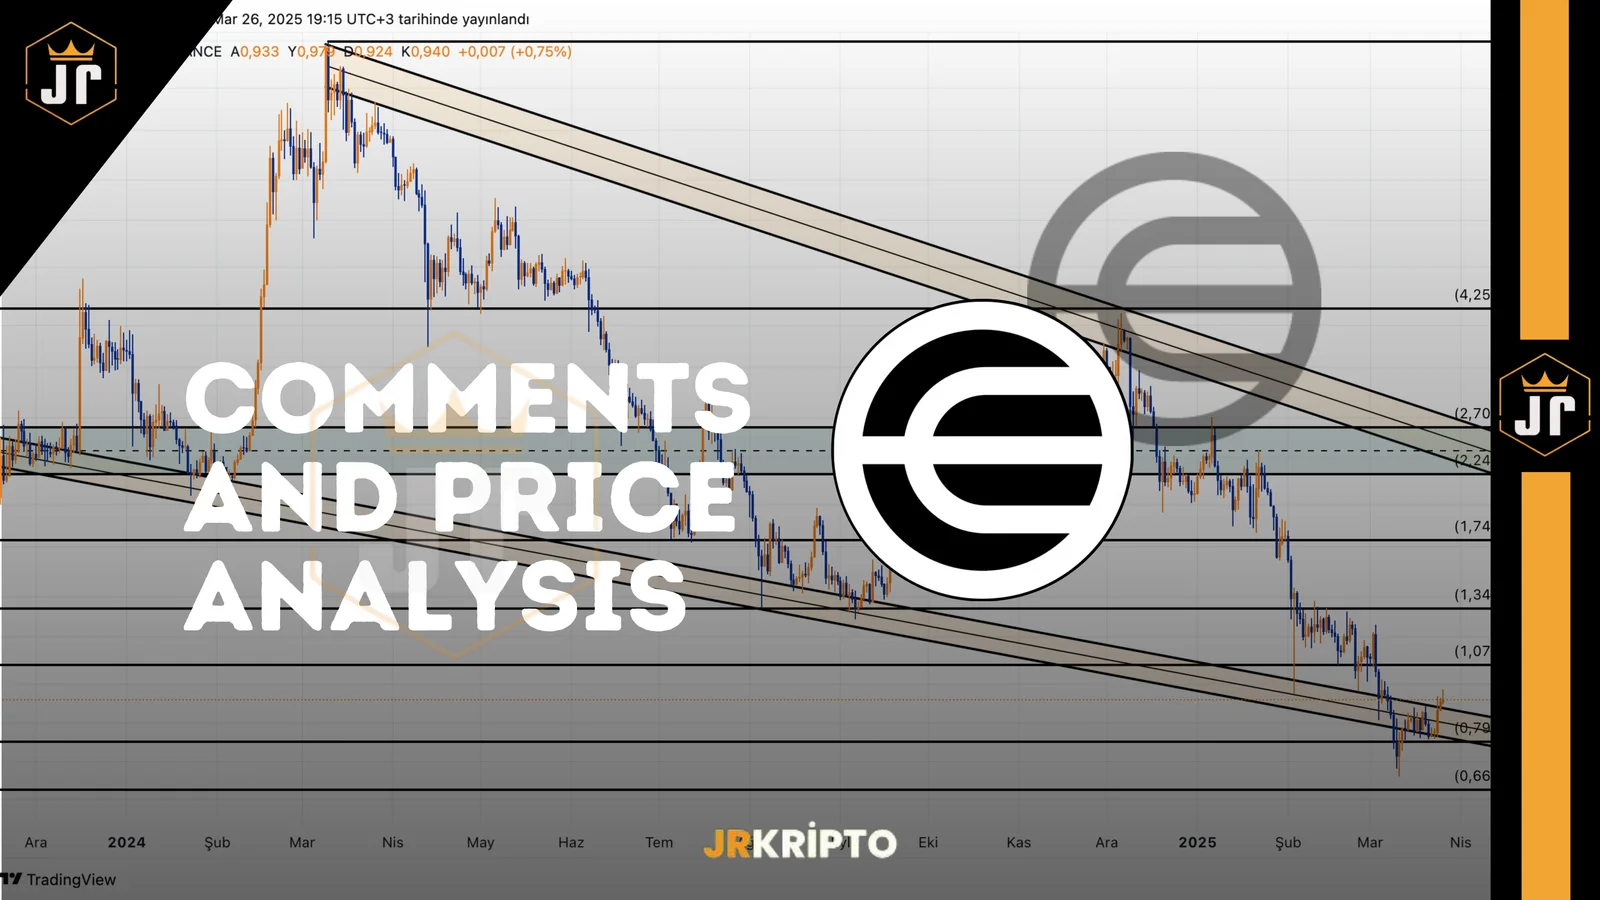
WLD: Comments and Price Analysis 26.03.2025
Worldcoin (WLD) Technical Analysis: On the Verge of Breaking the DowntrendWorldcoin (WLD) has managed to climb back up to its descending trendline after experiencing heavy selling pressure in recent months. The current price sits at $0.926 USDT, a critical level from a technical standpoint, as it aligns with the resistance of the downtrend that has been in place since December.If WLD fails to break this trendline, renewed downward pressure could emerge. However, a successful breakout would signal a potential trend reversal in the short term. WLD Key Technical Levels for WLD/USDTSupport Zones:$0.750 – Psychological support$0.701 – Major bottom levelResistance Zones:$1.022 – Downtrend resistance + short-term horizontal resistance$1.291 – $1.392 – Medium-term resistance range$1.720 – Area of previous heavy selling$2.126 – $2.292 – Long-term target zone$2.895 – $4.220 – Broad time-frame potential resistance areaThe red descending trendline on the chart represents a well-established resistance that has been tested multiple times, but not broken. In technical analysis, the more a trendline is tested, the stronger the breakout can be once it occurs.Currently, WLD is very close to this trendline. A daily close above it would confirm a bullish breakout. Otherwise, the price could retrace back to the $0.750 – $0.701 support zone.What Are the Technical Indicators Suggesting?RSI is in the neutral zone but has started to point upward, signaling potential momentum shift.Volume has noticeably increased over the past few days, indicating rising interest and suggesting any breakout may be supported by strong buyer activity.Suggested Strategy for TradersWatch for Breakout Confirmation: Wait for daily closes above $1.022 to validate the move.Risk Management: A close below $0.750 would invalidate the bullish scenario.Stepwise Targeting: If the trendline breaks, consider targeting the $1.291 – $1.720 range progressively.These strategies aim to help traders seize potential opportunities while minimizing risk as the price action unfolds.Worldcoin at a Pivotal Decision PointThe WLD/USDT pair is currently testing the descending trendline. The next movement from this level will be crucial in determining the direction. A breakout with strong volume could lead to a quick rally toward $1.29 and even $1.72 in the short term.However, if the price fails to break above and remains below the trendline, we may see continued consolidation or a pullback. That’s why this zone marks a key decision point for Worldcoin investors.Disclaimer: This analysis does not constitute financial advice. It is intended to highlight potential trading opportunities based on support and resistance zones under current market conditions. All trading decisions and risk management remain the responsibility of the individual. Use of stop-loss orders is strongly recommended.
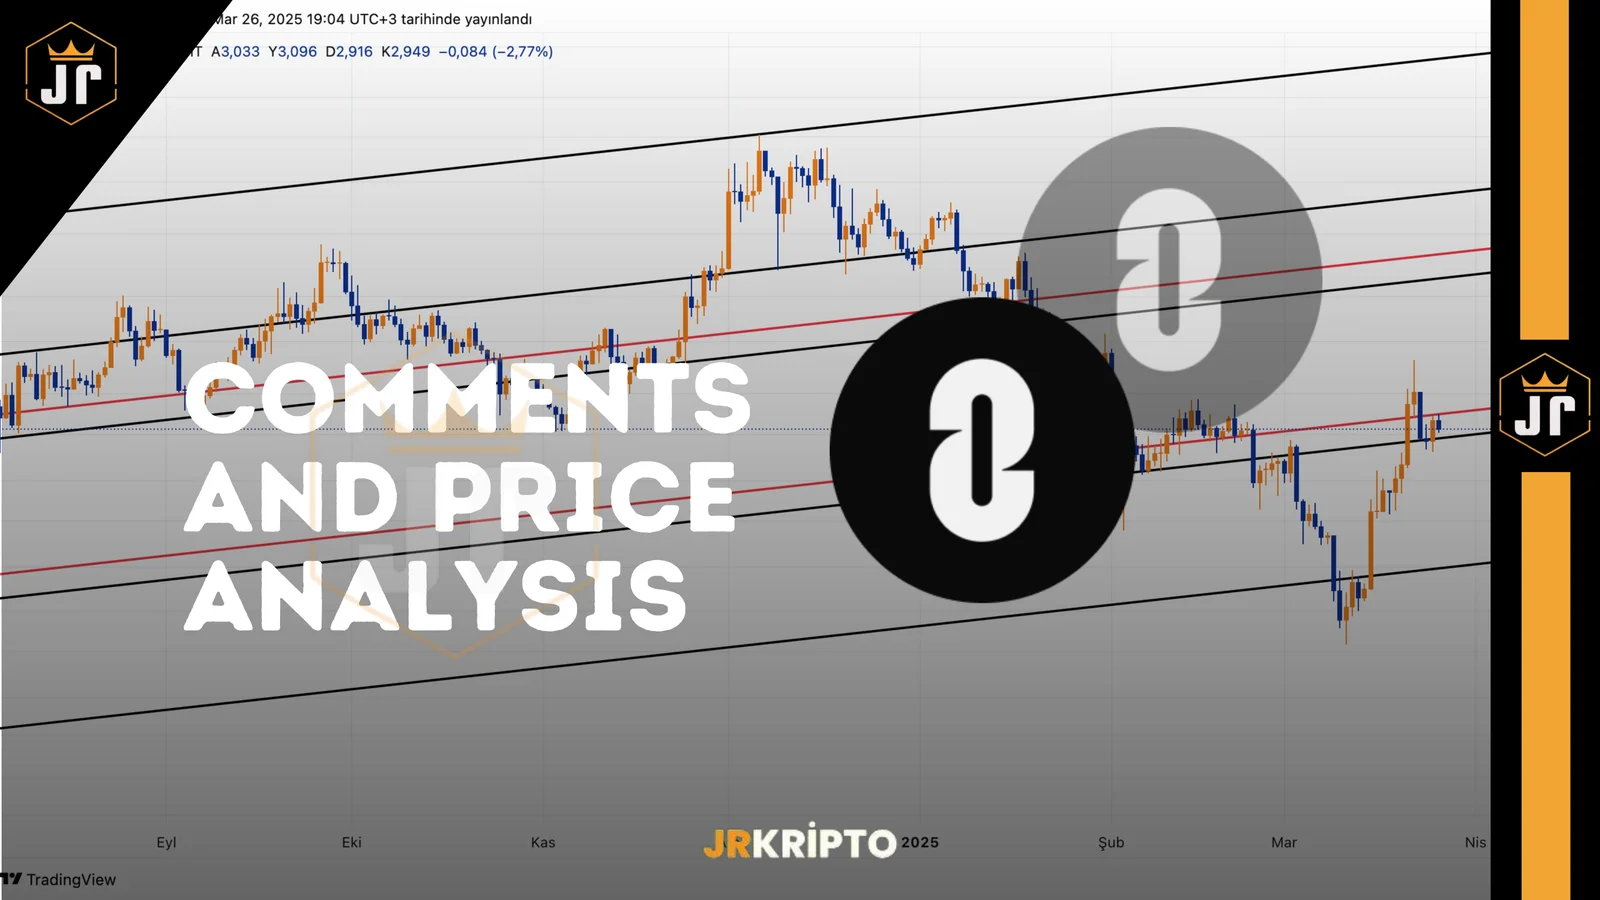
ZRO: Comments and Price Analysis 26.03.2025
LayerZero (ZRO) Technical Analysis: Breakout Confirmed—Is a Bullish Trend Underway?LayerZero has recently broken out of its long-standing descending channel, drawing significant attention in the crypto market. The ZRO/USDT pair is currently trading around $2.951, and this breakout marks a critical technical event. Breakouts from descending channels often signal the start of a new bullish trend.Previously, ZRO had fallen as low as $1.492, where it encountered strong buying interest and quickly rebounded, pushing above the channel’s upper boundary. The price is now testing the previous resistance zone between $2.774 and $2.591 as a new support. ZRO Key Technical Levels for ZRO/USDTSupport Zones:$2.774 – $2.591 – Key breakout support zone (previous resistance)$2.098 – Short-term support$1.492 – Previous bottom levelResistance Zones:$3.360 – Initial short-term resistance$4.069 – $4.357 – Medium-term resistance range$5.381 – Mid-to-long-term resistance$7.567 – Major long-term resistanceHolding above $2.774 is critical for ZRO to continue its move toward $3.360 and then $4.069, both of which have historically acted as strong reaction zones.What Does the Channel Breakout Indicate?The breakout from the descending channel confirms a shift away from bearish pressure, marking a potential trend reversal for ZRO/USDT. This has positively impacted market sentiment, giving the price room to move within a more bullish structure.Increased volume during the breakout further supports the move, while momentum indicators like RSI are showing upward divergence from the neutral zone—reinforcing the likelihood of continued upside.Suggested Strategy for TradersHold Above Support: Maintaining daily closes above the $2.774 – $2.591 zone keeps the bullish outlook intact.Target Resistance: The next key level is $3.360, which may act as a short-term target.Risk Management: A close below $2.591 could invalidate the bullish scenario, indicating the breakout may have been temporary.Post-breakout pullbacks are often healthy and provide better entries. If buyers step in again near the support zone, the bullish case for LayerZero could strengthen significantly.Is a Trend Reversal Underway for LayerZero?LayerZero may have officially ended its downtrend and entered a bullish structure. The technical breakout and support holding behavior suggest renewed upward potential. A confirmed break above $3.360 in the coming days could shift focus to medium-term targets and initiate a broader rally in ZRO/USDT.Disclaimer: This analysis does not constitute financial advice. It highlights potential support and resistance levels that could offer short- to medium-term trading opportunities under current market conditions. All trading decisions and risk management are the sole responsibility of the trader. Using stop-loss orders is strongly recommended.
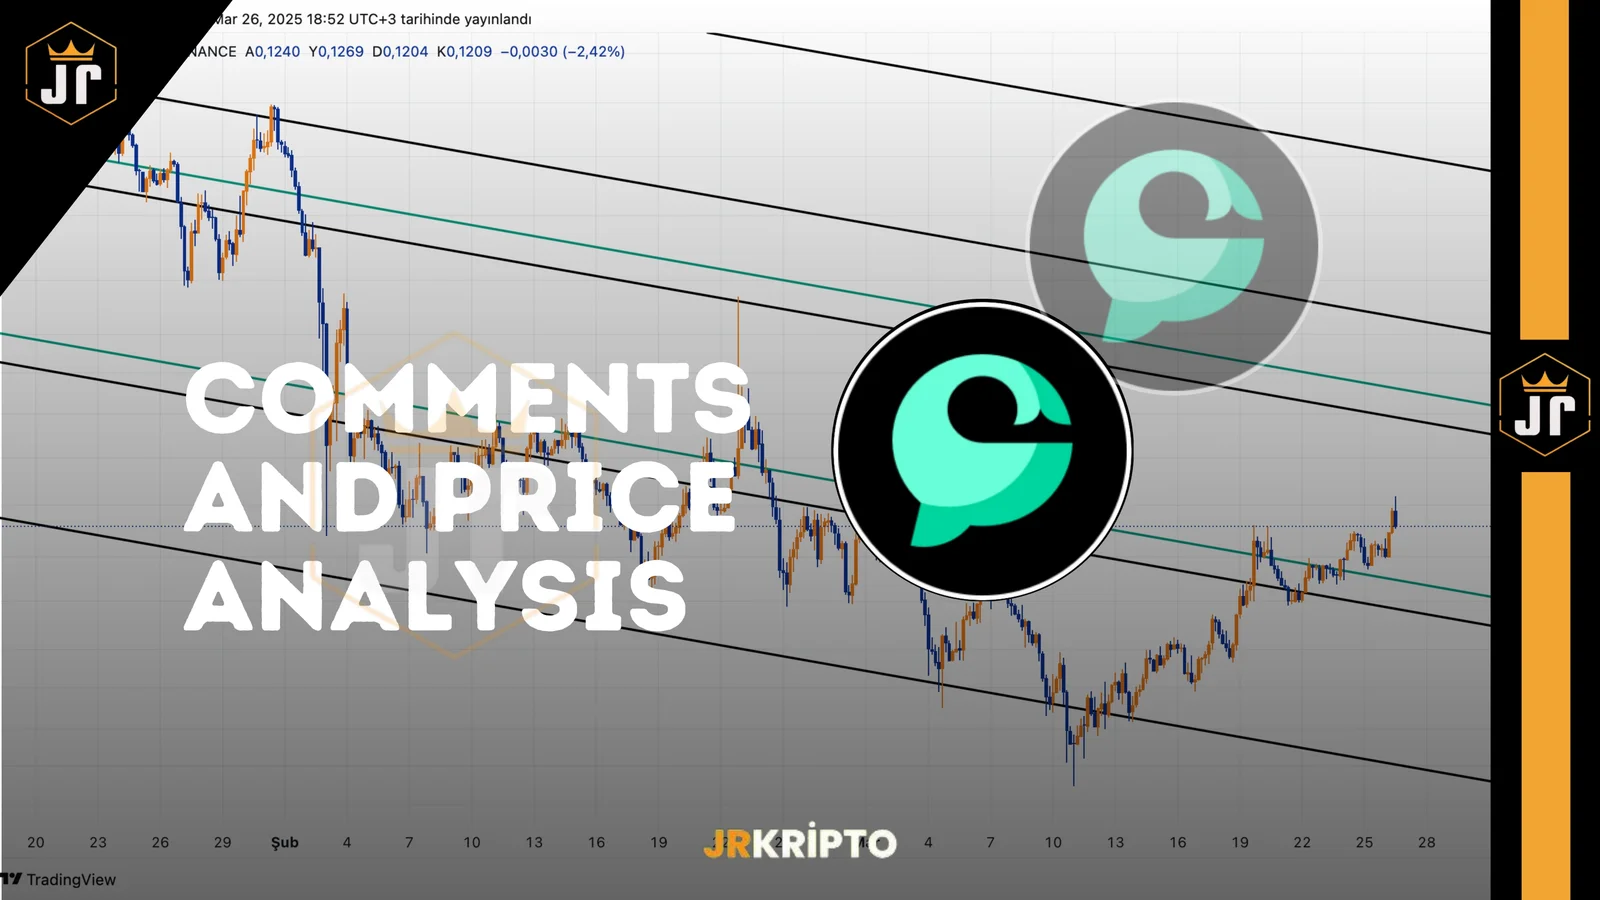
CETUS: Comments and Price Analysis 26.03.2025
Cetus Protocol (CETUS) Technical Analysis: Approaching a Key Breakout ZoneCetus Protocol is showing signs of a potential upward move within a long-standing descending channel pattern. Currently, the CETUS/USDT pair is trading at $0.1233, hovering near both the upper boundary of the channel and a key horizontal resistance level—suggesting a possible breakout is on the horizon.Since January, CETUS has been in a downtrend but has begun to recover from the $0.0788 support zone. A series of consecutive bullish daily closes and the break of lower low formations signal a potential shift in short-term momentum favoring buyers. CETUS Key Technical Levels for CETUS/USDTSupport Zones:$0.1160 – $0.1050 – Channel support zone$0.0870 – $0.0788 – Recent bottom levelsResistance Zones:$0.1474 – $0.1592 – First major resistance block$0.1979 – Previously tested resistance$0.2460 – $0.2658 – Medium-term resistance area$0.3377 – $0.4000 – Long-term upside targetsAs long as the price holds above $0.1160, the upward potential remains intact. The $0.1474 – $0.1592 zone will be critical in determining the direction of the next major move.What Happens If the Channel Breaks?The current narrowing channel structure often precedes sharp moves. Right now, the price is testing the channel’s upper band. A confirmed breakout above this level could spark a swift rally in the short term.What Should CETUS Traders Watch?Daily Close Above $0.1250: A close above this level would confirm a bullish breakout.Maintain Key Support: A close below $0.1160 would indicate renewed weakness.Staggered Targeting Strategy: Track key resistance levels from $0.1474 up to $0.1979 progressively.Rather than chasing impulsive moves, traders should wait for confirmed breakouts and set clear stop-loss levels to manage risk effectively.The First Steps of a Potential CETUS RallyCetus Protocol is technically nearing the end of its descending channel structure. Price action and indicators suggest growing potential for a short-term breakout to the upside. If the price manages a daily close above the channel, the first target for the CETUS/USDT pair will be around $0.1474.The overall outlook is increasingly positive, and the technical structure appears to be gearing up for a potential trend reversal—potentially marking the beginning of a new bullish wave for CETUS.Disclaimer: This analysis is not financial advice. It is intended solely for informational purposes, focusing on support and resistance zones that could offer short- to medium-term trading opportunities under current market conditions. All trading decisions and risk management are the sole responsibility of the trader. Using stop-loss strategies is strongly recommended.
Avalanche's Visa-Based Credit Card, Avalanche Card, Has Been Launched.
Avalanche Card: Visa-Backed Crypto Credit Card LaunchedThe Avalanche ecosystem has taken a significant step to facilitate the everyday use of cryptocurrencies. The new Visa-backed crypto credit card, Avalanche Card, has been launched in partnership with Rain. This card allows users to spend their digital assets such as USDC, USDT, AVAX, and Wrapped AVAX (wAVAX) directly, without converting them into any fiat currency.A New Era in Crypto SpendingThe Avalanche Card enables crypto payments in physical and online stores using Visa’s global payment network. The card is seen as a major innovation, especially in regions with limited access to financial services such as Southeast Asia, Africa, and Latin America.John Wu, President of Ava Labs, commented on the new product:"With Avalanche Card, cryptocurrencies become a powerful tool for everyday financial transactions. Mainstream adoption of digital assets will accelerate by offering practical solutions similar to traditional credit card usage."Cuy Sheffield, Head of Crypto at Visa, also highlighted the card’s convenience, saying:"Thanks to Visa’s wide acceptance network, crypto holders can now easily use their digital assets for daily purchases."No Need for Fiat ConversionOne of the most notable features of the Avalanche Card is that users can spend their crypto without having to pre-convert it into fiat currency. This provides a major advantage, particularly in regions where traditional banking infrastructure is lacking.Backed by the Avalanche Foundation, this innovative product aims to increase real-world usage of blockchain-based financial services. Sheffield added:"This step is a significant advancement in expanding access to digital payments in areas with limited financial inclusion."Avalanche Card and Its Impact on the Crypto EcosystemThe Avalanche network, known for its high transaction speed and scalability, provides a robust infrastructure for decentralized applications (dApps) and financial solutions. Thanks to the Avalanche Consensus Mechanism, the network enables near-instant transaction finality, making it more practical to use crypto assets for everyday transactions.The Avalanche Card is seen as a significant step toward integrating cryptocurrencies into the traditional financial system. Users will be able to pay with this card anywhere Visa is accepted. Additionally, the card will work in conjunction with a self-custody wallet, where each asset will have a unique address.This development could mark an important turning point in the mainstream adoption of cryptocurrencies in the financial world. The Avalanche Card aims to prove that cryptocurrencies can be used not just as investment tools, but also for daily spending.
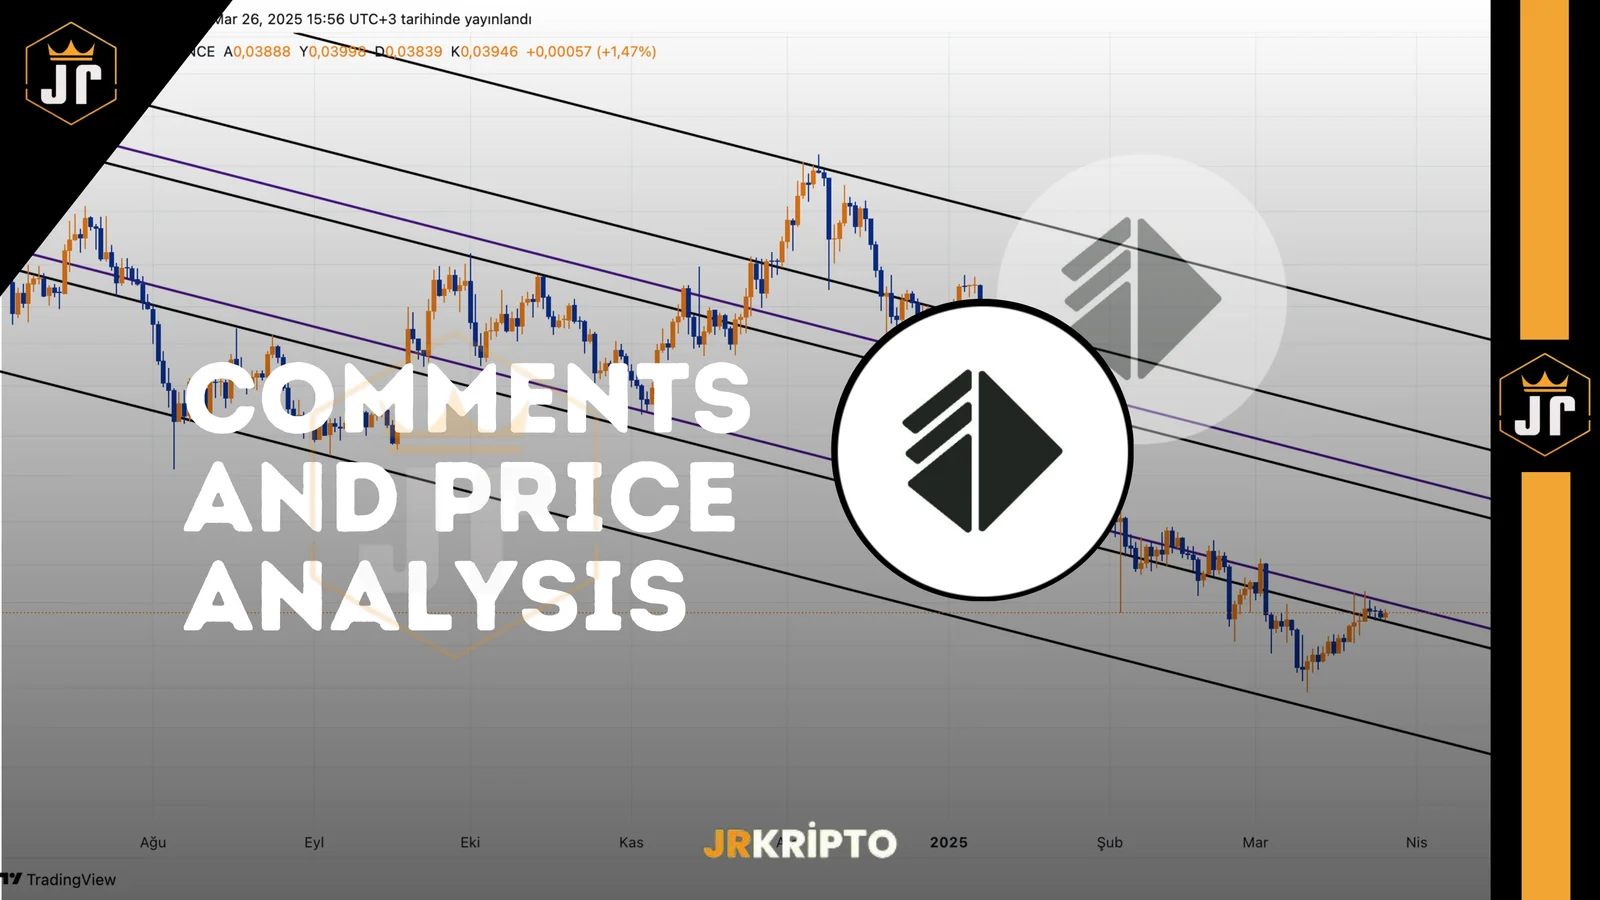
ALT: Comments and Price Analysis 26.03.2025
AltLayer (ALT) Technical Analysis: Testing the Channel ResistanceAltLayer has been trading within a descending channel pattern for quite some time. As of now, the ALTUSDT pair is priced at $0.03983, which is hovering close to both the upper boundary of the descending channel and a short-term horizontal resistance zone. The technical setup suggests that a breakout above this level could trigger a potential recovery move.Price Action OverviewOver the past few months, AltLayer has been forming lower highs and lower lows amid ongoing bearish pressure. However, recent price consolidation near the upper edge of the channel indicates that the downward momentum might be weakening. This sideways movement could be a precursor to a trend reversal.Key Technical Levels for ALTUSDTSupport Zones:$0.02950 – Lower boundary of the channel$0.03500 – Short-term support$0.04451 – May flip to support after a confirmed breakoutResistance Zones:$0.04451 – Channel top + horizontal resistance$0.05741 – $0.06252 – Medium-term resistance range$0.07854 – Previously a strong reaction area$0.09896 – $0.10744 – Major resistance zone$0.13859 and $0.20908 – Long-term target levelsIf the price manages to break above the $0.04451 resistance, the next target will be the $0.05741 – $0.06233 range. This area is crucial from both a technical and psychological standpoint, having served as a reversal zone in past price movements.Descending Channel & Market StructureThe descending channel in the chart highlights AltLayer’s controlled yet steady decline. Such formations often signal potential for sudden directional shifts. The frequent touches on the channel’s upper boundary increase the likelihood of an upward breakout.Strategy for TradersBreakout Confirmation: A close above $0.04451 could trigger a bullish scenario.Volume Analysis: Breakouts with strong volume are more sustainable; low-volume rallies may be false signals.Support Monitoring: A close below $0.03500 would signal a continuation of the downtrend.AltLayer at a Critical JunctureAltLayer is currently testing the upper limit of its descending channel. Technical indicators point toward the potential for short-term bullish momentum if this level is breached with strong volume. A confirmed breakout above $0.04451would set the first upward target at around $0.05759.The current price compression and horizontal consolidation within the channel suggest that a new trend could be forming. As such, AltLayer is at a technically pivotal level, and the price action in the coming days will be crucial in determining its direction.Disclaimer: This analysis does not constitute financial advice. It is intended for informational purposes only and highlights potential support and resistance zones based on market conditions. All trading decisions and risk management are the sole responsibility of the trader. Stop-loss usage is strongly recommended when entering any position.
Daily Market Summary with JrKripto 26 March 2025
Stay updated with the most significant developments in global and local financial markets in today’s “Daily Market Recap with JrKripto.” Let’s dive into the latest market trends and key insights.Crypto Market OverviewBitcoin (BTC) is currently trading at $88,100. The $79,100 – $80,763 zone remains a strong support area. BTC has successfully held this range, breaking above the $85,600 resistance level and maintaining its upward momentum. If the bullish trend continues, the next key resistance is expected around $90,700. On the downside, $85,600 will be the first support to watch in case of a pullback.Ethereum (ETH) is trading at $2,070. The $1,900 level remains a solid support, which triggered a rebound for ETH. With the $2,000 resistance broken, bullish momentum has picked up. The next target is $2,250, and if that’s breached, ETH could move toward $2,534 and $2,721. On the downside, $2,000 is the immediate support. A close below this level might bring $1,900 back into focus.Crypto News HighlightsTrump Media partners with Crypto.com.Circle becomes the first stablecoin issuer to gain regulatory approval in Japan.President Trump to launch $USD1, a dollar-pegged stablecoin via World Liberty Financial.CME Group teams up with Google Cloud to explore tokenization and improve capital market efficiency.Fidelity files with the SEC for a Solana Spot ETF.SEC drops the lawsuit against Ripple, according to Forbes.SEC ends its investigation into Immutable ($IMX).GameStop updates its investment policy to include Bitcoin as a treasury reserve asset.Top Gainers in CryptoGIGA → +27.4% to $0.0233DGB → +24.6% to $0.0112MOVE → +18.9% to $0.5375MEW → +18.4% to $0.0027FARTCOIN → +15.9% to $0.6353Top Losers in CryptoSATS → -21.0% to $0.1733NTGL → -20.3% to $0.0010PI → -10.0% to $0.8233CAKE → -8.1% to $2.39PRIME → -7.6% to $4.23Daily ETF FlowsBTC ETFs: +$26.80 MillionETH ETFs: -$3.30 MillionData to Watch Today17:30 (GMT+3) – US EIA Crude Oil InventoriesForecast: 1.5MPrevious: 1.745MGlobal Market OverviewYesterday, U.S. markets saw gains with the S&P 500 and Nasdaq rising by 0.2% and 0.5%, respectively, while the Dow Jones ended flat. The Communication Services sector led the way, up 1.3%, driven by Google and Meta. In contrast, Utilities fell 1.6%, becoming the worst-performing sector.Markets are now eyeing the U.S. durable goods orders at 15:30 GMT+3, alongside earnings reports from Cintas (CTAS), Paychex (PAYX), and Dollar Tree (DLTR).The S&P 500 technical outlook shows 5,732 as support and 5,897 as short-term resistance.Consumer Confidence Index dropped to 92.9, the lowest in three years, while 12-month inflation expectations rose from 5.8% to 6.2%.In energy, Brent crude held steady at $73 after Ukraine’s President Zelensky accepted a ceasefire covering Black Sea and energy infrastructure. Gold climbed 0.3%, reaching $3,020 per ounce.Top U.S. Stocks by Market CapApple (AAPL) → $3.36T | $223.75 | ▲ 1.37%NVIDIA (NVDA) → $2.94T | $120.69 | ▼ 0.59%Microsoft (MSFT) → $2.94T | $395.16 | ▲ 0.53%Amazon (AMZN) → $2.18T | $205.71 | ▲ 1.21%Alphabet (GOOG) → $2.09T | $172.79 | ▲ 1.68%Borsa Istanbul Market SnapshotEasing U.S. tariff expectations continue to support global markets. In Borsa Istanbul, strong communication from economic authorities and quick policy responses triggered a rebound after a 4-day, 18% drop. The BIST 100 index rose 4.5% yesterday to close at 9,715, moving above its 200-day moving average.Key resistance: 9,900 – 10,000Key supports: 9,550 – 9,400Turkey’s 5-year CDS started the day at 295 bps, down from a recent peak of 330. Regulatory flexibility for stock buybacks and falling interest rates are supporting the banking sector.Economic data:Real Sector Confidence Index rose to 103.2 in March.Capacity Utilization Rate increased to 75.2%, still below the historical average.2-year bond yield: 43.0%, 10-year bond yield: 31.3%Despite the rebound, the BIST 100 remains 10% below last week's levels. Investors are closely watching the CBRT’s sectoral inflation expectations report due today, which may shape market direction.Technical outlook: A break above the 9,784 – 9,895 zone could push the index to 9,990 – 10,197. Support levels include 9,594, 9,451, 9,221, 8,870, 8,725, while resistance lies at 9,784, 9,895, 9,990, 10,197, 10,323.Top Gainers on Borsa IstanbulYBTAS → ▲ 10.00% to 205,482.50 TLEUHOL → ▲ 10.00% to 18.15 TLBALAT → ▲ 9.99% to 52.95 TLDAGHL → ▲ 9.99% to 47.12 TLFONET → ▲ 9.98% to 14.55 TLTop Losers on Borsa IstanbulBMSCH → ▼ 60.56% to 11.20 TLATEKS → ▼ 9.98% to 81.20 TLANHYT → ▼ 9.55% to 94.70 TLAGESA → ▼ 6.50% to 126.50 TLYEOTK → ▼ 6.48% to 54.10 TLTop Market Cap Companies on Borsa IstanbulQNB Finansbank (QNBTR) → 1.17T TL | 341.75 TL | ▼ 2.36%Aselsan (ASELS) → 535.8B TL | 115.00 TL | ▼ 2.13%Garanti Bank (GARAN) → 499.38B TL | 118.20 TL | ▼ 0.59%Koç Holding (KCHOL) → 432.12B TL | 165.90 TL | ▼ 2.64%Turkish Airlines (THYAO) → 430.56B TL | 310.25 TL | ▼ 0.56%Precious Metals & Exchange RatesGold: 3,682 TLSilver: 41.26 TLPlatinum: 1,197 TLUSD/TRY: 37.99EUR/TRY: 41.08See you again tomorrow with the latest market updates!
The SEC Has Closed Its Investigation into Immutable ($IMX)
The Investigation Between Immutable and the SEC has Been Concluded.Dec.The US Securities and Exchange Commission (SEC) has officially closed its investigation into the Web3 gaming platform Immutable. Immutable was in danger of a possible sanction for the company's IMX token sale in 2021 after the Wells notification it received from the SEC in November 2024.Following the SEC's decision, there was a significant relief for the digital assets and gaming industry.Statement from Immutable After the DecisionRobbie Ferguson, the co-founder and president of Immutable, stated that they welcomed the SEC's decision positively. Ferguson stated that this decision supports Immutable's goals of bringing digital ownership and blockchain technologies to more players around the world.Is the SEC's Approach to the Digital Asset Sector Changing?Recently, there has been a significant softening in the approach of regulatory authorities in the US towards digital assets and blockchain companies. The SEC has also closed its investigations into major companies such as Robinhood, OpenSea and Yuga Labs. This situation shows that regulators are adopting a more positive and supportive attitude towards the sector.Immutable's Call for Regulatory ClarityImmutable executives, after this decision, again stressed the need for legal clarity for companies operating in the Web3 gaming industry. The company stated that the establishment of clear rules on tokenized in-game purchases and the regulation of digital assets will increase investor interest.These developments are critical for the future of digital asset and blockchain technologies and provide important signals about how the regulatory environment will be shaped in the future.
Trump-Backed World Liberty Financial Launches USD1 Stablecoin
What is USD1 Stablecoin?World Liberty Financial (WLFI), the decentralized finance (DeFi) platform supported by former US President Donald Trump and his family, has introduced its new stablecoin project USD1. USD1 was launched as a reliable and powerful digital asset, the value of which is fixed one-to-one to the US dollar.How Will USD1 Work?The USD1 stablecoin will have the following basic characteristics:It will be able to be converted into US dollars at a one-to-one rate.It will be backed by 100% US treasury bonds, dollar deposits and cash assets.Ethereum and Binance will be traded on the Smart Chain (BNB Chain) and will expand to other blockchains in the future.In this way, it will offer a stable value to its investors by protecting them from price fluctuations in the market.USD1 Reserve Security and InspectionsThe reserves of USD1 will be maintained by BitGo, the industry's trusted digital asset storage company. The regular audit of the reserves will be carried out by independent accounting companies. These audits and protection measures are among the critical factors that increase the confidence of investors. Dec.BitGo CEO Mike Belshe stressed that USD1 is an important milestone for institutional investors.With USD1, Traditional Finance and DeFi are MergingZach Witkoff, Co-Founder of World Liberty Financial, stated that USD1 will create a bridge between traditional financial institutions and decentralized finance (Dec). According to Witkoff, the strong connections of USD1 with the traditional financial sector may increase the interest of large investors and institutions in stablecoin.Unlike anonymous and algorithmic stablecoin projects, USD1 stands out with its clear regulatory compliance and transparent reserve management.The Impact of USD1 on the Market and its FutureEntering the market at a time when the regulations in the cryptocurrency market have become clearer and the use of stablecoins has increased, the USD1 has attracted great attention. This development:It can create new opportunities for both individual and institutional investors.It can bring innovation to the sector by increasing the competition in the stablecoin sector.It can support the growth of digital finance markets in general.Analysts believe that the launch of the USD1 stablecoin will accelerate the development and transformation in the field of digital finance.
Trump Media and Crypto.com important Partnership from: New Crypto ETFs Are Coming
New Move from Trump Media to the World of Digital AssetsDonald Trump's media company Trump Media & Technology Group (TMTG) has taken an important step to increase its influence in the crypto sector. The company, Crypto.com by signing a non-binding agreement with the crypto ETF, it aims to offer "Made in America"-themed crypto ETF products to the US, European and Asian Sundays.This initiative reveals Trump's intention to further expand his activities in the digital asset sector.Which Cryptocurrencies Will Be Included in ETFs?TMTG and Crypto.com the ETF products that will be launched with the partnership will include the following popular crypto assets:Bitcoin (BTC)Ethereum (ETH)Solana (LEFT)XRPCronos (CRO.), Crypto.com 'un's own tokenThese ETFs, Crypto.com it will be developed by Foris Capital US LLC, a subsidiary of . Crypto.com more than 140 million investors who use the app will have easy access to these ETF products.Regulatory Approvals and ExpectationsIn order for this partnership to come to life, the approvals of the relevant regulatory authorities are required first. Following the recent approvals granted by the US Securities and Exchange Commission (SEC) to Bitcoin spot ETFs, it is observed that interest in other digital asset ETFs has also increased.If these ETFs are approved, investors will be able to access digital assets more easily through large financial institutions.Political Debates and Trump's Crypto ActivitiesDonald Trump's crypto sector moves are causing controversy in the political arena. Initiatives such as the memecoin named "TRUMP" and the Trump-backed USD1 stablecoin are attracting the reaction of some politicians. Members of the House of Representatives Gerald Connolly and Maxine Waters criticize these initiatives as financial manipulation and abuse of the crypto sector.The Trump-Backed Stablecoin USD1 and Its Regulatory ImplicationsThe USD1 stablecoin, which was launched by World Liberty Financial on Ethereum and BNB Chain, was introduced with a supply of 3.5 million units. The stablecoin regulations (GENIUS Law) being discussed in the US Senate are expected to become law in June. The stablecoin project, in which Trump is directly involved in relation to these regulations, is inflaming the debate about the neutrality of the laws.TMTG Shares Are On The RiseCrypto.com after the partnership announcement with TMTG, there was a 9.4% increase in TMTG shares. This rise has revealed the interest of investors in both digital assets and traditional financial instruments. TMTG CEO Devin Nunes stated that they aim to add value to the US economy with this ETF initiative. Trump A New Era in Digital Asset MarketsTrump Media and Crypto.com its partnership could accelerate the integration of cryptocurrencies into financial markets. While this development provides great convenience for those who are considering investing in crypto assets, it may also increase the number of institutional investors in the sector. Thus, it is expected that cryptocurrencies will gain wider acceptance in global markets.
Sam Altman's World Network Is In Talks with Visa For Stablecoin Payouts
Innovative Cooperation on Stablecoin Payouts from World Network and VisaPaid payer World Network, the blockchain project founded by OpenAI CEO Sam Altman, has started negotiations with payment giant Visa to develop a stablecoin-based payment wallet. If this cooperation is realized, a radical change in digital finance and pay systems can be paved the way.What Can Visa and World Network Partnership Bring?World ID, the basic product of World Network, is a digital identity solution that allows users to authenticate their identities in a unique and secure way in a digital environment. The addition of Visa's powerful pay infrastructure to this innovative authentication system could make it easier to use stablecoins for everyday purchases.When this collaboration takes place, users:They will be able to use the stablecoins they hold in their World Network wallets with Visa cards.Thanks to Visa's extensive worldwide acceptance network, it will be able to spend its stablecoins anywhere.A New Bridge Between Traditional and Digital Finance DecDec Pay Stablecoins becoming available for everyday spending could reduce the difference between blockchain-based digital coins and traditional payment systems. The participation of a globally operating company such as Visa in this process can increase confidence in blockchain technology and accelerate the adoption of digital currencies. Sam Altman The Potential for Radical Transformation in the Financial WorldThis potential partnership creates an opportunity to expand the role of blockchain and cryptocurrencies in the financial services industry. Although no official announcement has been made yet, this development has caused great excitement in financial circles.With this move by Sam Altman, it will be very important and exciting to closely follow the developments that will take place in the financial and technological ecosystems in the coming period.

CME Group and Google Cloud Form Strategic Partnership for Tokenization
A New Era Begins in the CME Group and Google Cloud CollaborationCME Group, one of the largest derivatives exchanges in the world, has signed a strategic partnership with Google Cloud. This cooperation aims to increase efficiency in financial markets by using blockchain-based tokenization technology. The pilot applications of the project will start in 2026 and will open the door to a new era of digitalization in the sector.What is Tokenization and What is CME Group Aiming For?Tokenization is the process of representing physical or traditional financial assets as digital tokens. CME Group aims to achieve efficiency in the following areas by using the Universal Ledger (GCUL) system developed by Google Cloud:Collateral managementMargin calculationsClearing transactionsCommission payoutsTerry Duffy, CEO of CME Group, stated that thanks to this new technology, financial markets will get closer to the goal of trading 24/7.Google Cloud's Blockchain Investments Are GrowingGoogle Cloud attracts attention with its investments in blockchain technology. The company, which first integrated Bitcoin data into its platform, currently supports a total of 11 blockchain networks, including Ethereum, Arbitrum, Avalanche and Optimism. It is stated that the company will continue to strengthen the infrastructure of digital assets by increasing its blockchain investments.The Advantages that Tokenization Will Provide to the Financial WorldThe spread of tokenization can provide many advantages in traditional financial systems:Faster and cost-effective transactionsThe possibility of more liquidityHigh efficiency and ease of operationAccording to the World Economic Forum, only $25 trillion of the $230 trillion in assets around the world are used as collateral. Thanks to tokenization, more assets can be included in the financial system.The US' Leadership Goal in the Field of Tokenization and BlockchainThe United States is aiming for global leadership in blockchain and cryptocurrencies. In this context, the steps taken during Donald Trump's second presidential term and the SEC's positive approach to crypto assets may accelerate tokenization processes.BlackRock CEO Larry Fink emphasizes the importance of tokenization, while arguing that it is critical for the SEC to speed up these processes.Future Prospects For Financial MarketsThis partnership between CME Group and Google Cloud represents a major step for digital transformation in financial markets.Dec. With the start of the pilot application in 2026, transaction processes in the sector may become more flexible, fast and secure.This innovative initiative will lay the foundation for wider use of digital assets and significant developments in the financial sector in the future.
Circle Becomes the First Company in Japan to Receive a Stablecoin License
Circle Makes History By Getting the First Stablecoin License in JapanCircle became the first company officially able to conduct stablecoin transactions in the country with a license issued by the Japan Financial Services Agency (FSA). Circle's US dollar-pegged stablecoin, USDC, has been awarded the title of the first dollar-based stablecoin to be legally accepted in Japan.This development, which took place after a detailed regulatory process lasting about two years, allows the company to conduct its operations through Circle Japan KK.The Importance of the Partnership between Circle and SBI HoldingsCircle entered the Japanese Sunday by establishing a strategic partnership with SBI Holdings. With this cooperation:Blockchain-based financial innovation will gain momentum.The digital pay infrastructure will be strengthened.Positive effects will be provided to Japanese financial markets.USDC will be traded on the SBI VC Trade platform from March 26 and will soon be available on other important platforms such as Binance Japan, bitbank and bitFlyer.Japan's Advantageous Regulatory EnvironmentJapan's clear and strict regulatory policies have made it possible for Circle to launch USDC in a safe and transparent environment. This regulatory structure prevents uncertainties and allows companies to operate safely.The Future of USDC in JapanCircle aims to increase the use of USDC in digital pay solutions, cross-border transfers and corporate finance processes in Japan. Circle CEO Jeremy Allaire stated that the USDC will support the Japanese economy and strengthen the digital finance infrastructure.While Circle's stablecoin license is considered a significant development globally, it is expected to further consolidate Japan's leadership in fintech innovation.
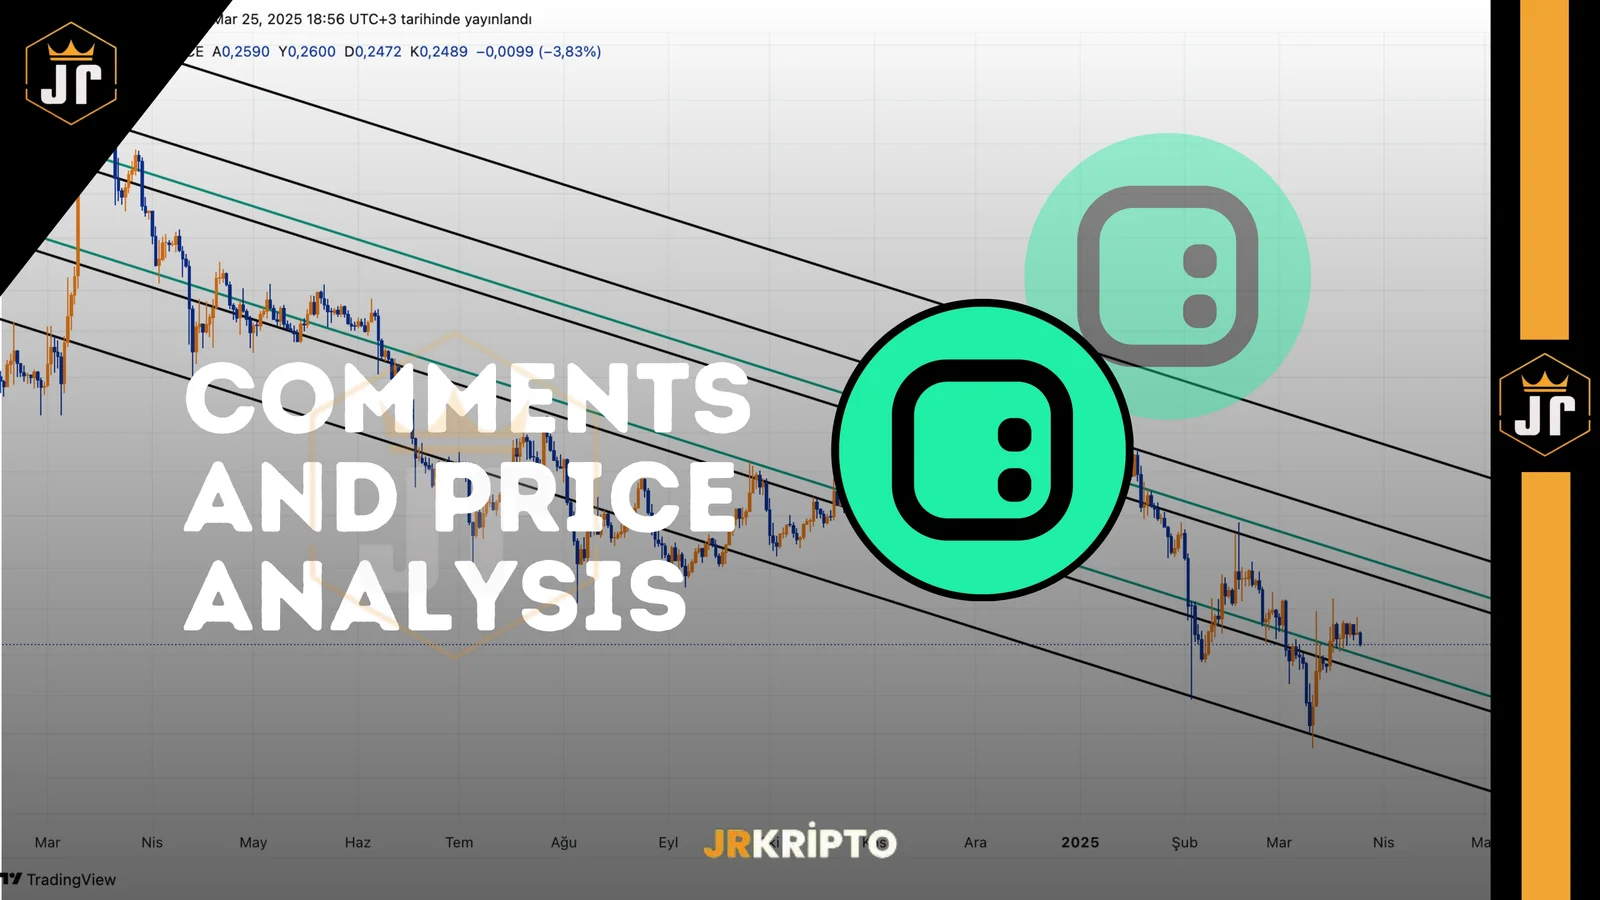
ID: Comments and Price Analysis 25.03.2025
Space ID (ID) Technical Analysis: Is the Horizontal Jam Ending?The Space ID Coin is exhibiting a horizontal squeeze within the channel formation, which has been falling in recent weeks. The IDUSDT pair is currently priced at 0.2506, and this level indicates a technically important decision zone. The price is based on both the upper band of the falling channel and the horizontal resistance zone. Therefore, it is quite possible that volatility will increase in the coming days. ID When we look at the past price movements, we see that Space ID Coin has received a strong reaction from the 0.2200 level. This region stands out as the support where the recent dips are formed and buyers are active. The current chart structure indicates the need for a break in order for the rise to continue.Outstanding Technical Levels For IDUSDTSupport Levels: 0.2365 (Short-term support) 0.2200 (Main support) 0.1950 (Lower band of the channel) 0.1700 (Oversold zone)Resistance Levels: 0.2864 – 0.3038 (Horizontal resistance + above channel) 0.3587 (Medium-term target region) 0.4235 – 0.4492 (Long-term resistance) 0.5394 (Main resistance)At the moment, the price is trying to stay above the 0.2365 support. Maintaining this level may lay the groundwork for the price to accelerate back to the 0.2864 – 0.3038 band. In particular, this region is considered to be a strong breaking area for both horizontal resistance and intersection with the upper boundary of the falling channel.What Does the Falling Channel Structure Tell?The falling channel on the chart shows that Space ID Coin has been under pressure for a long time. However, the contacts made to the upper band of this channel began to become frequent. This may mean that the trend is weakening and preparations are being made for a possible break.Although there is no significant increase in the volume side yet, the price making high dips can be considered as a bullish signal. If a close above 0.2864 occurs, a technical trend change may be on the agenda for Space ID Coin. This may also trigger new waves of purchases.Strategy Suggestions For Investors 1. Short-Term Follow-up: The positive scenario remains valid as long as the hold above 0.2365 continues. 2. Channel Breakage: Closures above 0.3038 may trigger an increase in the medium term. 3. Stop Level: Closures below 0.2200 mean a transition to a risky zone.Conclusion: The Breakdown in Space ID Coin Is ApproachingThe Space ID Coin rested on the upper band of the falling channel, holding on to a strong support area. Technical indicators indicate that buyers are about to gain strength. If the 0.2864 – 0.3038 December breaks volumetrically in the coming days, a medium-term positive trend may start in the IDUSDT parity.This compression in the channel structure can be a harbinger of a potential trend transformation. From this point of view, Space ID Coin may be on the verge of a new ascension story.These analyses, which do not offer investment advice, focus on support and resistance levels that are thought to create trading opportunities in the short and medium term according to market conditions. However, the responsibility for making transactions and risk management belongs entirely to the user. In addition, it is strongly recommended to use stop loss in relation to shared transactions. Author: Ilaha
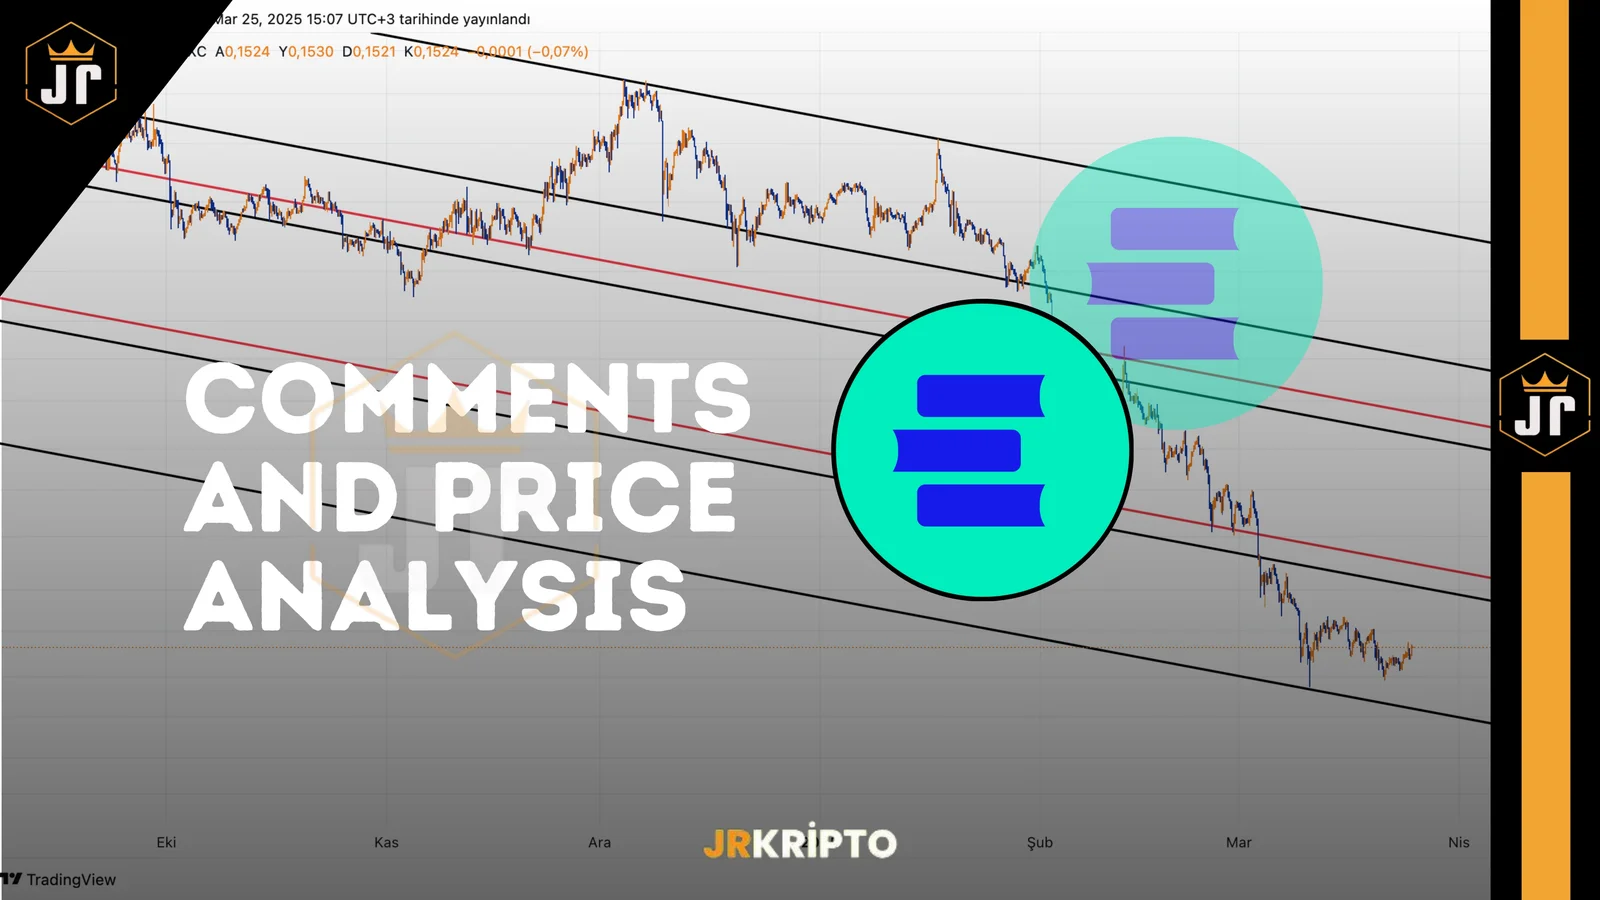
EDU: Comments and Price Analysis 25.03.2025
Open Campus (EDU) Technical Analysis The EDU/USDT pair has been priced in a descending channel for a long time. According to the current chart data, the price is at 0.1498 levels. This indicates that it is very close to critical support areas.The fact that EDU Coin is under pressure attracts the attention of investors. Especially the hardening declines in the recent period reveal the strength of the downward trend in technical terms. However, the structures formed on the chart may now give a possible return signal due to the approach to the lower band of the falling channel. EDU Critical Technical Levels For EDU/USDTSupport Levels: 0.1250 (Channel lower limit) 0.1490 – 0.1500 (Psychological threshold)Resistance Levels: • 0.1899 (Initial technical resistance) • 0.2334 – 0.2495 (Channel upper band and horizontal resistance) • 0.3008 (Wide-time target region) • 0.3627 – 0.3876 (Key area for trend reversal) • 0.4763 (Long-term main resistance)According to the EDU/USDT technical analysis, the price is trying to hold on to the 0.1500 support. This region is very critical both in terms of being close to the channel subband and working as a support in the past. If this level is broken downwards, the 0.1250 region can be tested.What Does the Channel Formation Tell?The striking element on the chart is that the falling channel is in a very narrow structure. Such structures are usually considered as accumulation zones. In other words, investors can start to collect positions during periods when the price is suppressed but at the same time creates a bottom.Especially when the volume indicators and momentum data such as RSI are examined, it seems that the oversold zone has been reached for EDU Coin. This indicates that short-term reaction purchases may be possible. However, in order for these reactions to be permanent, the price must first break the resistance of 0.1899 in volume.What Should be the Investor Strategy in EDU Coin?Trend Break Tracking: Daily closures above 0.1899 should be monitored.Volume Confirmation: If there is no increased volume in upward movements, the rise may be short-lived.Conclusion: Footsteps of the Rise in EDU CoinEDU Coin may be nearing the end of a long-standing downtrend. Technical indicators and channel structure indicate a possible turn signal. The price reaching the bottom regions offers an important opportunity for investors. Especially if permanence is achieved above the 0.1500 level, the probability of a short-term recovery may strengthen.If the first upward break is experienced at the 0.1899 level, a rapid recovery may begin in the EDU/USDT parity. This may cause the price to accelerate towards the resistances of 0.2334 and 0.3008, respectively. While the chart presents a positive picture for patient investors, it indicates that EDU Coin may become the center of attention again.These analyses, which do not offer investment advice, focus on support and resistance levels that are thought to create trading opportunities in the short and medium term according to market conditions. However, the responsibility for making transactions and risk management belongs entirely to the user. In addition, it is strongly recommended to use stop loss in relation to shared transactions. Author: Ilaha
Daily Market Summary with JrKripto 25 March 2025
You can access the "Daily Market with JrKripto" summary below, where we have compiled important daily developments in cryptocurrency, global and local markets. Come on, let's analyze the general situation in the markets together and take a look at the most up-to-date assessments. Bitcoin (BTC) is currently trading at $87,400. While the $79,100 - $80,763 region stands out as a strong support area, BTC has broken through the $85,600 resistance by holding on to this level and is continuing to rise. If the upward movement continues, the $90,700 level will be a critical resistance point. However, if the price retreats, the $85,600 level will be followed as the first support point.Ethereum (ETH) is trading at $2,070. While the $1,900 level was maintained as a strong support point, ETH received an upward reaction from this level. With the breaking of the $2,000 resistance, the rise gained momentum and the next target will be the $2,250 level. If this level is exceeded, acceleration towards the $2,534 and $ 2,721 levels may be seen. On the other hand, downward movements will be followed by the support of $ 2,000, and closures below this level may bring the support of $1,900 back up.Crypto NewsDWF Labs has launched a $250 million fund to support blockchain projects.Strategy has purchased 6911 BTC.Justin Sun: "I'm expecting something big this week!”Sam Altman's World Network is in talks with Visa for a Stablecoin pay walletTrump plans to postpone the industry-specific customs duty increases that were expected to be launched on April 2.CryptocurrenciesThose Who Have Risen The Most:CRO →increased by 27.1% to $0.104846.LAYER →rose 27.1% to $1.35.AGENTFUN → jumped 25.6% to $2.13.IBERA → jumped 16.6% to $8.01.KET →increased by 15.0% to $ 0.26392759.The Ones Who Fell The Most:NTGL → fell by 17.6% to $0.00123252.ANKR →fell by 9.3% to $0.02025293.ZRO →fell 6.6% to $2.77.PNUT → fell 5.6% to $0.2086054.VENOM →fell 4.9% to $0.11931917.Total Net ETF Inflows Per Day BTC ETFs: $84.20 Million ETH ETFs: $0.0 Million Data to Follow Today17:00 - USA | Conference Board (CB) Consumer Confidence (March)Expectation: 94.2Previous: 98.317:00 - US | New Home Sales (February)Expectation: 682KPrevious: 657KGlobal MarketsUS stock indexes started the week positively due to the impact of news flows over the weekend. In particular, expectations that customs duties will not be as far-reaching as expected and that sectors such as automotive, semiconductors and pharmaceuticals may be exempt were reflected positively on the market. The S&P 500 gained 1.76%, the Dow Jones 1.42% and the Nasdaq 2.27%. The S&P 500 Index technically finished the day above its 200-day moving average. While 10 of the 11 main sectors in the index closed the day with a rise, the infrastructure sector achieved a horizontal negative close. Tesla gained 11.93%, pulling the discretionary consumer sector up, and the sector's shares gained 4.07%, becoming the best performing sector. Telecommunications gained 2.11%, industrial gained 1.87%, financial gained 1.79% and technology gained 1.71%.When we look at the macroeconomic data, the S&P Global manufacturing PMI data for March in the United States remained well below the expected 51.9 with 49.8, while it declined by 2.9 points on a monthly basis. This indicates that the manufacturing sector has moved into contraction territory again after two months. On the other hand, the service sector data increased by 3.3 points on a monthly basis and exceeded the expectation of 51.2 and was announced at 54.3. The US composite PMI increased by 1.9 percentage points to 53.5 per month in March. February January and February It is estimated that this recovery in the service sector is due to the recovery of activities that were reduced due to adverse weather conditions and may be temporary.January February also saw the Chicago Fed National Activity Index in the U.S. rise to 0.18 from -0.08 in January. Manufacturing-related indicators led the increase, while the index's three-month moving average rose to 0.15, the highest level in the last three years. Today, US housing prices, new home sales, Richmond Fed Manufacturing Index and Conference Board Consumer Confidence Index data will be announced. While Asian indices are tracking negatively, European indices are expected to have a horizontal negative start to the day.The Most Valuable Companies and Their Stock PricesApple (AAPL) → market capitalization of $3.32T, price per share is $220.73, an increase of 1.13%. NVIDIA (NVDA) → market capitalization of $2.96T, price per share is $121.41, an increase of 3.15%. Microsoft (MSFT) → market capitalization of $2.92T, price per share is $393.08, an increase of 0.47%. Amazon (AMZN) → market capitalization of $2.15T, price per share is $203.26, an increase of 3.59%. Alphabet (GOOG) → market capitalization of $2.06T, price per share is $169.93, an increase of 2.21%.Borsa IstanbulBorsa Istanbul rose yesterday with a reaction purchase of up to 3%. Although there is some money inflow into the market, it is estimated that this is mainly public-sourced purchases. For this reason, it is not possible to talk about a generally widespread entry into the market at the moment. However, the fact that there is a balancing on the exchange rate and interest rate side may support a reaction movement after the recent sharp declines. While high volatility is expected to continue, positions can be tried by paying attention to close support and stop levels in the short term. In the medium and long-term outlook, expectations are maintained that the BIST 100 index may rise above the 14,000 level.Today, the real sector confidence index, capacity utilization ratio (KKO) and sectoral confidence indices will be followed inside. While the Real Sector Confidence Index and Retail Trade Confidence Index rose in February, the Services and Construction Confidence Index declined. KKO, on the other hand, had risen to 74.9% in February. In addition, Treasury and Finance Minister Mehmet Şimşek is expected to hold a teleconference with international investors today at 16:00 TSI.When we look at bond rates, the 2-year bond rate increased by 1.0 points to 45.6% yesterday, while the 10-year bond rate decreased by 0.2 points to 33.2%. The BIST 100 index made an effort to recover yesterday after last week's sharp declines and ended the day at 9299 with a rise of 2.8%. Although intraday fluctuations were experienced, the index moved upwards, finding support at the 8873 level.Technically, the close support level for the BIST 100 index is seen as the 8980-8725 band. A rise of the index above the 9921 level may create some optimism, but for a stronger upward trend, it is necessary to rise above the 9450-9594 band. In this case, the 9784-9895 band may be brought up again. In terms of downside risks, the 8870 level is considered as interim support, while the 8618-8560 region, which was tested in November 2024, is considered as strong support. Dec. The important support levels for the BIST 100 are 8870-8725-8618-8560-8000, while the resistance levels are 9451-9594-9784-9895-9990.The Shares That Increased The Most:VSNMD → increased by 10.00% to 158.40 TL.REEDR → increased by 9.99% to 11.89 TL.SAMAT → increased by 9.99% to 16.96 TL.AKFIS → increased by 9.99% to 19.93 TL.ENSRI → reached TL 18.27 with an increase of 9.99%.The Most Declining Shares:ATEKS → fell by -9.98% to TL 90.20.DAGHL → fell by -8.33% to 43.60 TL.BINBN → fell by -7.07% to TL 162.90.NUHCM → fell by -5.14% to TL 262.75.TKFEN → fell by -3.85% to TL 125.00.The Companies with the Highest Market Capitalization in Borsa Istanbul:QNB Finansbank (QNBTR) → Market value of TL 1.13 trillion, price per share is TL 345.75, an increase of 2.90%.Aselsan Electronics Industry (ASELS) → Market value of TL 549.02 billion, price per share is TL 119.30, a decrease of 0.91%.Garanti Bank of Turkey (GARAN) → market value of TL 465.36 billion, price per share is TL 118.70, an increase of 7.13%.Turkish Airlines (THYAO) → market value of TL 418.14 billion, price per share is TL 313.00, an increase of 3.30%.Koç Holding (KCHOL) → Market value of TL 412.34 billion, price per share is TL 170.40, an increase of 4.80%.Precious Metals and Foreign Exchange PricesGold: 3680 TL Silver: 40.85 TL Platinum: 1204 TL Dollar: 37.94 TL Euro: 41.16 TL Hope to meet you again tomorrow with the latest news!
